Using statistical methods to detect central fixation in a pediatric vision screener
For a more detailed version of this research report, please read the following publication:
Gramatikov, B.I., Irsch K, Wu Y-K, Guyton, D.L. New Pediatric Vision Screener - Part II. Electronics, Software, Signal Processing and Validation. BioMedical Engineering OnLine (Springer); First online: 04 February 2016. Open Access.
http://link.springer.com/article/10.1186%2Fs12938-016-0128-7
http://biomedical-engineering-online.biomedcentral.com/articles/10.1186/s12938-016-0128-7
http://www.ncbi.nlm.nih.gov/pubmed/26847626
Our laboratory has been developing novel technologies for detecting accurate eye alignment directly, by exploiting the birefringence (property that changes the polarization state of light) of the uniquely arranged nerve fibers (Henle fibers) surrounding the fovea (the small area of the retina responsible for sharp central vision). Retinal birefringence scanning (RBS) is a technique that uses the changes in the polarization of light returning from the eye to detect the projection into space of the array of Henle fibers surrounding the fovea. In RBS, polarized near-infrared light is directed onto the retina in a circular scan, with a fixation point in the center, and the polarization-related changes in light retro-reflected from the ocular fundus are analyzed by means of differential polarization detection. Due to the radially symmetric arrangement of the birefringent Henle fibers, a characteristic frequency appears in the obtained periodic signal when the scan is centered on the fovea, indicating central fixation. For example, in the simplest possible type of analysis, when scanning around the center of the fovea, one would obtain a signal of frequency twice the scanning frequency, whereas a para-central scan would return a signal of just the scanning frequency. By analyzing frequencies in the RBS signal from both eyes simultaneously, the goodness of eye alignment can be measured, and thus strabismus can be detected. RBS technology is the only known technology that can detect central fixation remotely using true anatomical information (position of the fovea). An early version of the “Pediatric Vision Screener” (PVS) was designed in our lab and tested at Children’s Hospital, Boston. This is being developed into a commercial prototype that detects eye alignment but not defocus (REBIScan, Boston, MA). In a recent study, this prototype was compared with the SureSight Autorefractor. Its sensitivity to detect strabismus and amblyopia (0.97; 95% CI, 0.94-1.00) was significantly higher than that of the SureSight Autorefractor (0.74; 95% CI, 0.66-0.83). The specificity of the REBIScan screener for strabismus and amblyopia (0.87; 95% CI, 0.80-0.95) was significantly higher than that of the SureSight Autorefractor (0.62; 95% CI, 0.50-0.73). Meanwhile, development of the RBS technology continued in our lab, resulting in a series of central fixation detecting devices with no moving parts, devices for continuous monitoring of fixation, a device for biometric purposes, and ultimately an improved PVS that combines “wave-plate-enhanced RBS”, or “polarization-modulated RBS”, for detecting strabismus, with added technology for assessing proper focus of both eyes simultaneously. Polarization-modulated RBS is an optimized upgrade of RBS, based upon our theoretical and experimental research and computer modeling, using a spinning half wave plate (HWP) and a fixed wave plate (WP) to yield high and uniform signals across the entire population. In addition, using phase-shift-subtraction, the new PVS eliminated the need for initial background measurement.
It was necessary to optimize the decision making and validate the performance of this research instrument that also serves as a prototype for a screening device for amblyopia risk factors in young children.
Central fixation (CF) detection. The retina is scanned with a low-power focused beam of linearly polarized light. Upon reflection from different points surrounding the fovea, polarization is changed differently. After certain optimization using a polarization-manipulating wave plate (optical retarder), the S1 Stokes component can satisfactorily describe the polarization change and yield an RBS signal. In the Stokes vector representation of the polarization state of light, S = [S0, S1, S2, S3], S1 represents the intensity difference between the horizontal (p) and the vertical (s) linearly polarized components. In our earlier devices we used a polarizing beam splitter (PBS) to measure the s- and p-components separately, before building the difference electronically. This, however, required two photodetectors for each eye, and extremely precise balancing, before building the difference in analog differential stages. An alternative would have been to complete the whole analog chain separately for the s- and p-components (photodetectors-filters-amplifiers), digitize separately, and then build the difference in software, thus doubling the size of the hardware. In the present design, we use a double-pass spinning half-wave plate (HWP), which rotates the axis of linear polarization by twice the angle between its fast axis and the input’s plane of polarization. Due to this property of polarization rotation, the spinning HWP enables measurement of the two orthogonal polarization states with the same photodetector at different points in time, thereby avoiding errors associated with gain mismatch. Using a computer model involving all polarization-changing components of the system, including the Henle fibers and the cornea, we found that by spinning the HWP 9/16ths as fast as the circular scan, strong signals are generated that are odd multiples of half of the scanning frequency. With central fixation, two frequency components predominate the RBS signal: 2.5 or 6.5 times the scanning frequency fs, depending on the corneal birefringence. With paracentral fixation, these frequencies practically disappear, being replaced by 3.5 fs and 5.5 fs. Therefore, the relative strengths of these four frequency components in the RBS signal distinguishes between central and paracentral fixation.
The instrument design has been explained in detail elsewhere. Briefly, linearly polarized light emitted continuously by a 785-nm laser diode is transmitted by a plate polarizing beamsplitter (PBS) toward a half-wave plate (HWP) that is spun by a motor using a pulley ratio to achieve a rotation 9/16ths as fast as the scan. After passage through the rotating HWP, the beam of continuously rotating linearly polarized light enters the scanning unit that consists of two gold-plated plane mirrors. The scanning unit is driven by the same motor, thus turning the stationary beam of light into a circular scan. Light from the outer scanning mirror travels toward the eyes. While each eye is fixating on a blinking red light, appearing to be in the center of the scanning circle, each retina is scanned by the spot of laser light in a circle subtending a visual angle of 3° in diameter. A small percentage of light reflected from each ocular fundus is re-imaged back, following the same light path it originally came from, via the principle of conjugacy. The unchanged part of the returning light, in other words the part with the same polarization as the original light, is transmitted through the PBS, back toward the light source, thus never making it to the detection unit. The changed part of the returning light, on the other hand, is reflected by the PBS toward the photodetector assembly, consisting of two bull’s-eye photodetectors (BEPDs), one for each eye. A band pass filter assures that only light in the desired wavelength range reaches the detectors.
The fixation target is a red 690-nm laser diode flashing on and off to attract the child’s attention. The fixation light is positioned physically conjugate to the circular scan of the 785-nm laser. However, as eyes do not accommodate (focus) well on monochromatic light, we employ an improved target system with accommodative control. A vertical black-and-white grid (not shown), printed on a transparency, serves as an accommodative target, which is illuminated by a white-light LED array. This white-light accommodative background is imaged 1:1 into an aerial image plane that is 33 cm away from the subject, a standard near testing distance for children. To account for the eye’s longitudinal chromatic aberration, the image of the RBS spot of 785-nm light is located 0.75 D farther away than the 33 cm distance of the accommodative grid target, at 44.4 cm. Thus, with an eye fixating on the blinking red light, with focus controlled by the black-and-white background at 33 cm, the near-infrared light from the scanning 785-nm laser diode will be in proper focus on the retina.
Criterion for central fixation. As described before, retinal birefringence scanning in the foveal region results in the generation of four distinct frequencies in the signal obtained from the returned light. These frequencies are acquired by performing FFT, and their power spectrum components are P2.5 and P6.5 for central fixation frequencies 2.5fs and 6.5fs respectively, and P3.5 and P5.5 for para-central fixation frequencies 3.5fs and 5.5fs, respectively. Power spectrum component P4.5 (for 4.5fs) is independent of the direction of gaze. Because all the above components depend on subject-specific factors such as pupil size, reflectivity of the retina, retinal and corneal birefringence, instrument design, etc., spectral powers P2.5, P6.5, P3.5 and P5.5 are normalized by P4.5, thus making them dependent mainly on the direction of gaze.
With all four spectral components available, it is still not trivial to establish a decision making logic which allows precise detection of CF or lack thereof. To find a statistically reliable solution, as part of the CF calibration procedure, we recorded signals from additional five asymptomatic normal volunteers, ages 10, 18, 24, 29 and 39, all properly consented. The subjects were asked to look first at the blinking target in the center of the scanning circle, for CF. Twelve measurements were taken for each one of them, each lasting 1 s. The raw signals, as well as the calculated FFT powers for each measurement, were saved on disk. The same type of measurement was repeated with each of the subjects looking at imaginary “targets” on the scanning circle (1.5⁰ off center), at 12, 3, 6, and 9 o’clock. The data, consisting of powers P2.5, P6.5, P3.5, P5.5 and P4.5 for each of the 12 measurements of each eye of all five test subjects, were bundled into two groups: a group for central fixation (120 “eyes,” the “CF set”) and a group for para-central fixation (480 “eyes,” the “para-CF set”).
Analysis was performed in MATLAB. Two algorithms were developed for classification into one of the two classes (CF vs para-CF) using the available signal power measurements:
Method 1 employed a gradual change of the threshold for (P2.5+P6.5)/ P4.5 in order to optimize a single threshold for the sum of only central fixation frequencies. The threshold θ for decision making was increased in small steps of 0.001, starting with θmin = 0.3 and ending with θmax = 8.00. At each level i, the error for central fixation was calculated as the sum of the absolute values of the individual errors for the CF set:
![]() (1)
(1)
where (Pj,CF2.5 + Pj,CF6.5)/ Pj,CF4.5 is the normalized sum of the two central fixation powers for each CF measurement j, and θi is the threshold at the current level i. Similarly, the error for para-central fixation was calculated as the sum of the absolute values of the individual errors for the para-CF set:
![]() (2)
(2)
where (Pj,paraCF2.5 + Pj,paraCF6.5)/ Pj,paraCF4.5 is the normalized sum of the two central fixation powers for each para-CF measurement j, and θi is the threshold at the current level i. The algorithm chooses the threshold θi that minimizes the total error:
![]() (3)
(3)
Method 2 employs linear discriminant analysis, basically using a linear combination of features (in our case the normalized signal powers) to separate the two classes (CF vs para-CF). We used a linear classifier which generally provides a solution in the form
K + PLT = 0 (4)
Where P is the features vector, while K and L define the coefficients ai of the discriminant function. For example, a three-way linear discriminant analysis provides a plane in the form
K + [x y z] LT = 0 , P = [ x y z ] , L = [ L(1) L(2) L(3) ] (5)
where x, y, and z stand for (P3.5+P5.5)/ P4.5 , P2.5/ P4.5 , and P6.5/ P4.5 , respectively. Classification is based on the linear classifier
z = a0 + a1x + a2y (6)
where a0=-(K/L(3)), a1=-(L(1)/L(3)), and a2 = -(L(2)/L(3)). The measurement to be classified is considered belonging to the class of central fixation if P6.5/ P4.5 > z (as calculated above). The two- and four way discriminant analyses are similar and will not be discussed in detail here.
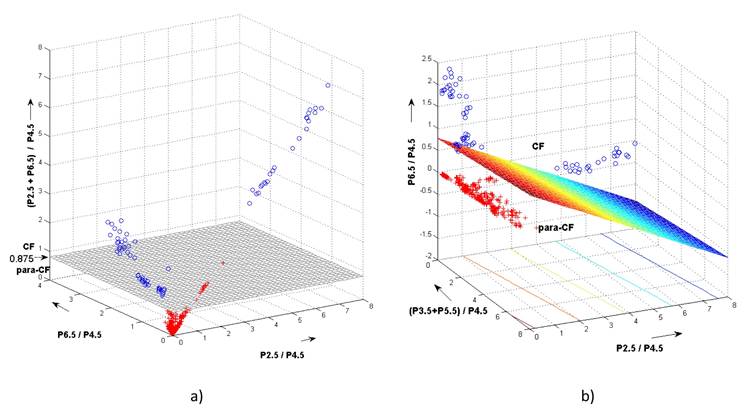
The two methods used to distinguish between central- and paracentral fixation. The blue circles are measurement with central fixation, whereas the red crosses stand for paracentral fixation.
a) Simple threshold for (P2.5+P6.5)/P4.5 (Method 1)
b) Three-way discriminant analysis (Method 2 for the 3D case). Shown is the discriminant plane.
The results obtained with Method 1 and all three cases of Method 2 are summarized in Table 1:
|
|
Simple threshold (Method 1) |
Discriminant Analysis (Method 2) |
||
|
θ = 0.8750 |
2D
a0 = 0.743, a1 = 0.318 |
3D
a0 = 0.768, a1 = 0.056, a2 = -0.289 |
4D
a0 = 0.779, a1 = 0.016, a2 = -0.283, a3 = 0.083 |
|
|
Sensitivity |
0.9917 |
0.9083 |
0.9417 |
0.9417 |
|
Specificity |
0.9625 |
0.9771 |
1.0000 |
1.0000 |
Table 1 Performance of the different methods for classifying fixation as central vs. para-central. All methods use spectral power at odd multiples of half the scanning frequency fs. Method 1 uses optimized simple threshold, whereas Method 2 utilizes 2-, 3-, and 4-way linear discriminant functions, whose coefficients are shown in the table.