Pupil size dynamics during dark adaptation, in the presence of
fixation on a target
Pupil size can
directly affect the amount of light that reaches retinal structures and is
returned by them in full-pupil, double-pass measuring technology, such as
retinal birefringence scanners (Hunter et al.,
2004), scanning laser
ophthalmoscopes (Webb and Hughes, 1981), scanning laser polarimeters (Weinreb et al.,
1995), optical
coherence tomography (OCT) devices (Huang et al.,
1991) etc. Since
retinal illuminance is proportional to the area of the entrance pupil (Atchison and Smith, 2000), the signals obtained by the above
mentioned devices from the light reflected from the retina strongly depend on
pupil size. A number of investigators have reported the relationship between
luminance and pupil size. (Watson and Yellott, 2012) Yet these publications use a
steady state (after adaptation), ignoring pupil dynamics, and do not mention
the influence of accommodation. Numerous publications describe also the acute
“lights-off” effect and the slower dark adaptation (Loewenfeld, 1993), but there appears to be very
little information on how pupil size changes in the first several minutes after
ambient lights are turned off and while the subject is fixating on a target,
which are usually the conditions when double-pass systems are used. It is known that both fixation and
accommodative effort cause pupil constriction, thus eliminating some
peripherally entering rays and masking high-order monochromatic aberrations.
But the interplay between this phenomenon, known as accommodative pupillary
constriction (Wolffsohn et
al., 2006; Charman and Radhakrishnan, 2009), and the
competing, or rather counteracting pupil dilation due to dark adaptation, is
not well studied. The goal of this study was to determine the extent of pupil
size changes, and to potentially find a time window during which the pupil size
is maximal, to allow best conditions for obtaining information from the retina
at maximum signal-to-noise ratio.
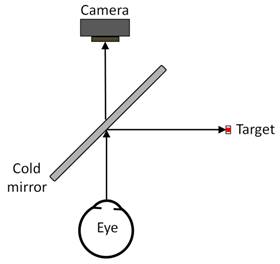
Figure
1. Optical setup used to measure the
pupil size.
We studied 5 test subjects, age 28-60, all
properly consented. After a period of 10 minutes of room-light adaptation, the
subjects were asked to fixate on a white-light partially accommodative target
(a red dot with a white border, 3x1.5 mm), optically 33 cm from the eye. The
target was front-on illuminated constantly by a faint electric bulb, providing
background luminance in the area of the target of about 1.10-2 cd/m2, just enough to enable the test subject to
fixate. The ambient illumination was turned down immediately after initiation
of the recording, from 27 cd/m2 to about 2.10-3 cd/m2.
Pupil diameter was measured under monocular conditions (with one eye occluded)
by means of an eye tracking apparatus (Ramey et al.,
2008) using
video-oculography and comprising an
infrared-sensitive USB video camera (240x320 pixel resolution; Web Digital
Camera, Hong Kong) equipped with a 12 mm fixed-focal-length lens (Figure 1).
Near- infrared illumination of the pupil was provided by an infrared light
emitting diode (OD-50L, 880 nm; Opto Diode Corp.,
Inc., Newbury Park, CA). The camera was connected to a desktop computer that
controlled video frame capture using custom acquisition software written in
MATLAB (MathWorks, Inc., Natick, MA). We used image
acquisition with a frame rate of 5 fps, with continuous recording. The recorded
eye’s image sequences were analyzed off-line. Pupils were approximated with
circles, and their diameters were calculated with commercial eye tracking
software (IRIS; Chronos Vision, Berlin, Germany).
Pupil detection uses edge detection and the Hough transform (Duda and Hart, 1972; Ballard, 1981) to identify a circle
in a parameterized space. Blinks were detected as abrupt drops of more than 30%
in pupil diameter, lasting for 200-400 ms), and were
replaced by the preceding value. Pupil area was calculated based on the
diameter measured from each frame. In order to compare pupil behavior across
test subjects, and possibly derive a general trend, the pupil area traces were
normalized:
![]() (1)
(1)
Where A(t) is the area measured in time, A(0) is the baseline
value at the initial moment when the light was turned off, and An(t)
is the normalized area.
Results
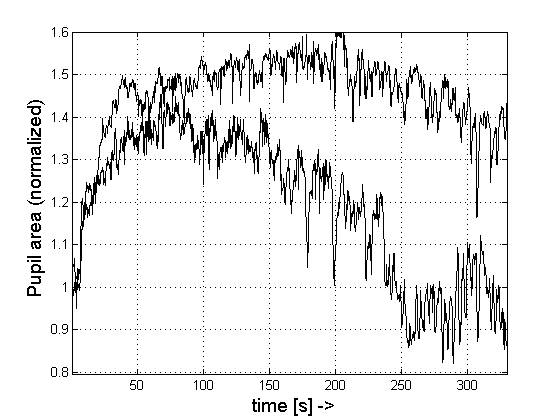
Figure 1. Pupil dynamics during dark adaptation Upper trace:
without accommodation; lower trace: with accommodation on a target. Pupil area
in mm2, time in seconds.
Figure 1, upper trace,
shows the non-normalized trace from one subject as pupil area vs. time, plotted
over 6 minutes (360 s) after the lights were turned off, with the subject not
accommodating. Figure 1, lower trace, shows the same type of curve from the
same subject, now accommodating. Figure 2 shows the normalized traces of all
subjects studied.
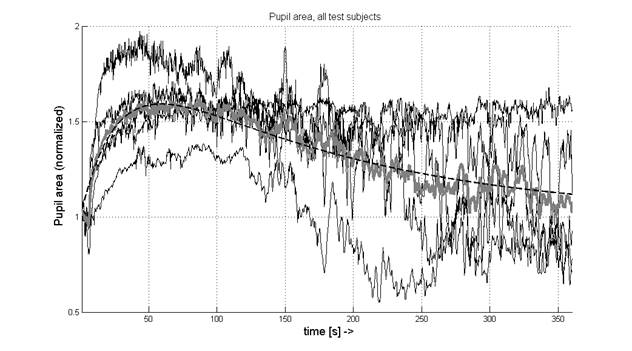
Figure 2. Normalized pupil area of
all subjects studied. The time is in seconds. The dashed line shows the
exponential fit of the averaged curve (please note that the Y-axis starts from
0.5).
In addition to the
individual traces, the average trace is also shown (thick gray line). The
dilation reaches its maximum, with area 60% above the baseline level, at a time
of about 70 s. Then the average normalized curve starts descending
exponentially toward the baseline.
The normalized traces
were then approximated in MATLAB using a nonlinear least-squares regression fit
with the following model function:
![]() (2)
(2)
where
the time t is in seconds. For each
fit it was assured that the estimated coefficients fell into the 95% confidence
interval using the Jacobian of function (2), returned by the fit. The
coefficients a1 and a2 from the individual traces, as well as from
the average trace, are shown in table 1.
Table 1. Estimated coefficients for the exponential
fit for the individual traces and for the averaged trace
|
|
Individual traces |
Coefficients for averaged trace |
|||||
|
Subject 1 |
Subject 2 |
Subject 3 |
Subject 4 |
Subject 5 |
Averaged coefficients |
||
|
a1 |
0.0287 |
0.0714 |
0.0199 |
0.0174 |
0.0325 |
0.0340 |
0.0310 |
|
a2 |
0.0058 |
0.0037 |
0.0153 |
0.0032 |
0.0042 |
0.0064 |
0.0059 |
There is minimal
difference between the last two columns of the table, indicating that averaging
the estimates of the individual approximations yields nearly the same results
as the approximation on the averaged trace.
The estimated curve according to equation (2) is plotted on figure 2 as
a dashed black line.
Discussion
Although this study has
not investigated specific clinical patient groups, it has shown that there is a
definite pattern in the change of pupil size during dark adaptation and in the
presence of an accommodative effort. However, there were marked inter-subject
variations in pupil size progression over time, as can be seen on figure 3. We
think that the first and foremost cause for this was the different level of
accommodation provided by the different subjects. One likely reason for this was the different
ability to accommodate, which is age dependent, and probably to some extent the
use of an imperfect target, which was small but probably lacking enough detail.
But there is also the direct effect of age on pupil size. One study showed that
pupil diameter increases slightly across age groups between 1 and 19 years(MacLachlan and Howland,
2002) while other studies have reported
that pupil size becomes smaller in an almost linear manner with increasing age.(Winn et al.,
1994; Koch et al., 1991) Moreover, the rate of change with
age is fastest at lower luminances, as is the present
case. Yet, since our study deals with relative changes with respect to a
light-adapted baseline, we observed a clear pattern of a relative fast initial
increase, and then slower decrease in pupil size.
With
the limited number of subjects, this study is merely a proof of concept.
Investigating the presence or absence of accommodation, inter-subject
variability, age-related variability, and day-to-day variability of pupil size
dynamics, by means of analysis of variance, is expected to shed more light on
the phenomenon studied, and will most likely lead to more precise criteria for
the optimal timing of retinal scanning during dark adaptation. Of interest, a
study by Bradley and coworkers showed that gender and iris color have no
significant effect on the dark-adapted pupil diameter.(Bradley et al.,
2010)
The
mechanisms involved in the “lights-off” response are mainly the parasympathetic
relaxation and sympathetic activation (Loewenfeld, 1993) causing dilation.
The mechanism involved in accommodative pupillary constriction is quite
different, involving changes in the accommodative state via the convergence-accommodation
mechanism. The extent of influence of each of these mechanisms, and hence the
location of the maximum pupillary size found by us, might well be influenced by
the variable factors mentioned above, which warrants further investigation.
Algorithms
may be developed for adjusting the coefficients of the exponential fit a1 and a2 in accordance with valid variability factors,
so that the software in retinal scanning instrumentation may suggest the best
possible time window for acquiring data with maximum signal-to-noise
ratio.
Conclusion
We observed a certain
variance between the plots, most likely attributable to a different level of
accommodation attempt for the different subjects. Yet, when accommodation
attempt was present, the pupil size followed a specific pattern – a sudden
increase, followed by a relatively flat peak, then an exponential decay toward
the baseline. Based on the signal traces in figure 2, it can be concluded that
measurements between 27 s and 110 s are likely to be performed at a pupil area
at least 50% larger than the baseline. The pupil size appears to be maximal at
about 60 s after “lights off”. This
should be taken into consideration when optimizing the time window for measurements
on retinal structures with whole-pupil, double-pass systems, when subjects are
fixating on a target. As shown in Table 1, in all subjects the coefficient a1, characterizing
the initial rate of pupil change, is significantly larger than coefficient a2, which
describes the slower exponential decay after reaching the maximum. This implies
that it is important, after dimming the ambient light, to wait for at least 30
s before starting measurement. The optimal time window for the measurements,
according to these results, is during the second minute after dimming the
light.
Most of the above material has been
published also in the following paper:
Gramatikov, BI, Irsch, K, and Guyton, D; "Optimal timing of retinal scanning during dark adaptation, in the presence of fixation on a target: the role of pupil size dynamics. Journal of Biomedical Optics, 2014, 19(10), 106014. doi:10.1117/1.JBO.19.10.106014.
http://biomedicaloptics.spiedigitallibrary.org/article.aspx?articleid=1921066%20&journalid=93
References
Atchison D A and Smith G 2000 Optics
of the Human Eye Butterworth-Heinemann: Oxford
Ballard D H 1981 Generalizing the Hough transform to detect
arbitrary shapes Pattern
Recognition, Elsevier 13 111–22
Bradley J C, Bentley K C, Mughal A I, Bodhireddy H, Young R S
and Brown S M 2010 The effect of gender and iris color on the dark-adapted
pupil diameter J Ocul Pharmacol Ther 26 335-40
Charman W N and Radhakrishnan H 2009 Accommodation, pupil
diameter and myopia Ophthalmic Physiol
Opt 29 72-9
Duda R O and Hart P E 1972 Use of the Hough Transformation to
Detect Lines and Curves in Pictures. Comm.
ACM 15 11-5
Huang D, Swanson E A, Lin C P, Schuman J S, Stinson W G,
Chang W, Hee M R, Flotte T, Gregory K, Puliafito C A and Fujimoto J G 1991
Optical coherence tomography Science 254 1178- 81
Hunter D G, Nassif D S, Piskun N V, Winsor R, Gramatikov B I
and Guyton D L 2004 Pediatric Vision Screener 1: instrument design and
operation. Journal of Biomedical Optics
9 1363-8
Koch D D, Samuelson S W, Haft E A and Merin L M 1991
Pupillary size and responsiveness. Implications for selection of a bifocal
intraocular lens Ophthalmology 98 1030-5
Loewenfeld I E 1993 The
Pupil: Anatomy, Physiology, and Clinical Applications Iowa State University
Press and Wayne State University Press:
Detroit
MacLachlan C and Howland H C 2002 Normal values and standard
deviations for pupil diameter and interpupillary distance in subjects aged 1
month to 19 years Ophthalmic Physiol Opt
22 175-82
Ramey N A, Ying H S, Irsch K, Mullenbroich M C, Vaswani R and
Guyton D L 2008 A novel haploscopic viewing apparatus with a three-axis eye
tracker J AAPOS 12 498-503
Watson A B and Yellott J I 2012 A unified formula for
light-adapted pupil size J Vis 12 12
Webb R H and Hughes G W 1981 Scanning laser ophthalmoscope IEEE Trans Biomed Eng 28 488-92
Weinreb R N, Shakiba S and Zangwill L 1995 Scanning laser
polarimetry to measure the nerve fiber layer of normal and glaucomatous eyes Am J Ophthalmol 119 627-36
Winn B, Whitaker D, Elliott D B and Phillips N J 1994 Factors
affecting light-adapted pupil size in normal human subjects Invest Ophthalmol Vis Sci 35 1132-7
Wolffsohn J S, Ukai K and Gilmartin B 2006 Dynamic
measurement of accommodation and pupil size using the portable Grand Seiko
FR-5000 autorefractor Optom Vis Sci 83 306-10