Optical Coherence Tomography (OCT)
Optical Coherence Tomography (OCT) is an
imaging technique that utilizes the interferometry. The interferometer invented
by Michelson sent a beam of light through a half-silvered mirror (beam splitter)
splitting the beam into two paths. After leaving the beam splitter, the beams
travelled out to the ends of long arms where they were reflected into the
middle of small mirrors, and were then recombined in an eye piece, producing a
pattern of interference. If the two optical paths differ by a whole number of
wavelengths, the interference is constructive, delivering a strong signal at
the detector. If they differ by a whole number and a half wavelengths (odd
number of half-wavelengths), the interference is destructive and the detected
signal is weak.
It can be shown [1] that the intensity measured at the photodetector of a
low-coherene interferometer is a sum of three
components – the backscattered
intensities received respectively from the sample and reference arm, and
the interference signal that carries the information about the structure of the
sample, and depends on the optical path delay between the sample and the
reference arm:
|
|
(1) |
where
|
|
(2) |
and τ is the time
delay corresponding to the round-trip optical path length difference between
the two arms:
|
|
(3) |
with c being the
speed of light, n - the refractive index
of the medium, and ls and lr -
the geometric lengths of the two arms.
The normalized mutual coherence function Vmc(τ) in the above equation is a
measure of the degree to which the temporal and spatial characteristics of the
source and reference arm match. Since a
temporal coherence function is actually the Fourier transform of the power
spectral density S(k) of the light source (Wiener-Khinchin
theorem), the above equations can be rewritten to [1-3]:
|
|
(4) |
where k0=2π/λ0 is the average wave number and the
relation λ0= c/f0 is used to transform from the time domain to
the path domain [1].
With OCT, as with the classical
Michelson interferometer, light is split into two arms – a sample arm scanning
the retina, and a reference arm, which is typically a mirror. After reflection
(respectively from the sample and from the reference mirror) light is
recombined and directed to the sensor, which can be a simple photodetector, or
a camera. Figure 1 shows a typical optical setup of an OCT system containing a
moving reference mirror. Systems containing a movable mirror are also called
time-domain (TD) OCT systems. A
measurement beam emitted by the light source is reflected or backscattered from
the object (the retina) with different delay times, depending on the optical properties
of the layers comprising the object. A longitudinal (axial) profile of
reflectivity versus depth is obtained by translating the reference mirror, thus
changing the path length in the reference arm. For each point on the retina,
the magnitude of the intensity of the resulting interference fringes is
recorded for each position of the reference mirror, i.e. for each depth. In
order to extract the depth-signal carrying component, the detection electronics
usually contains three main circuits: a) a transimpedance
amplifier, b) a
band-pass filter centered at the Doppler frequency defined as fd = 2ν / λ0 (ν: speed of the moving mirror; λ0 : the central
wavelength of the light source), and c)
an amplitude demodulator to extract the envelope of the interferometric signal.
[4]
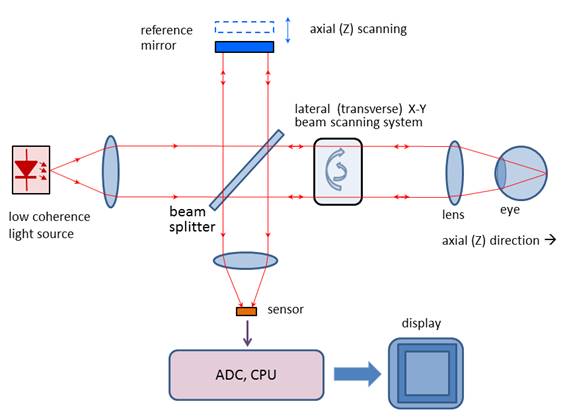
Figure 1
Scanning the light beam on the retina
enables non-invasive cross-sectional imaging with micrometer resolution. OCT is
based on low coherence interferometry [5-8]. In conventional interferometry with long coherence length, which is
the case with laser interferometry, interference occurs over a long distance
(meters). In OCT, low coherence light is used. A low coherence light source
consists of a finite bandwidth of frequencies rather than just a single
frequency. Thanks to the use of broadband light sources (emitting over a broad
range of frequencies), this interference is shortened to a distance of micrometers.
Broad bandwidth can be produced by superluminescent
light emitting diodes (SLDs) or lasers emitting in extremely short pulses
(femtosecond lasers). With no lateral X-Y scanning, the information from only
one point on the retina is read, at a depth defined by the position of the
reference mirror. Lateral (transverse) scanning provides a 2D image for the
particular depth chosen. In some designs, instead of X-Y scanning, a camera
functioning as a two-dimensional detector array was used as a sensor (full-field
OCT optical setup). There are two types of designs that use a moving reference
mirror – a free-space and a fiber-based design. A free space design (as in
Figure 1) can provide very high resolution images by using custom designed
lenses, compensating components in the reference arms, and dynamic focusing to
prevent loss of contrast [9]. Instead of dynamic focusing, the more popular
fiber-based systems reduce the effects of transversal (lateral) resolution loss
by acquiring and subsequently fusing multiple tomograms obtained at different
depths at the same transverse location [1, 10-13]. Figure 2 shows a generalized fiber-based TD OCT system.
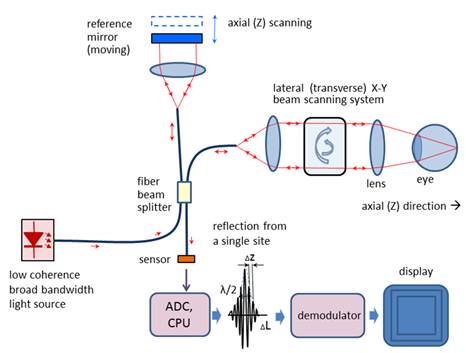
Figure 2
OCT typically employs near-infrared
(NIR) light. The use of relatively long wavelength allows light to penetrate
deeper into the scattering medium. Confocal microscopy, as used in cSLO’s, typically penetrates less deeply into the retina.
The transverse
resolution for optical coherence tomography is the same as for
conventional microscopy, being determined by the focusing of the optical beam.
The minimum size to which an optical beam can be focused is inversely
proportional to the numerical aperture of the angle focus or the beam: [1, 14]
|
|
(5) |
where λ is the wavelength, d is
the spot size on the objective lens, and
f is the focal length. High transverse
resolution can be achieved by using a large numerical aperture and focusing the
beam to a small spot size. In addition, the transverse resolution is related to
the depth of focus or the confocal parameter b, which is two times the Rayleigh range zR:
|
|
(6) |
With other words, increasing the
transverse resolution produces a decrease in the depth of focus. The
signal-to-noise ratio (SNR) is given
by the expression: [14]
|
|
(7) |
where η is the quanum
efficiency of the detector, hν is the photon
energy, P is the signal power,
and NEB
is the noise equivalent bandwidth of the electronic filter used to demodulate
the signal. The axial resolution of OCT
is primarily determined by the bandwidth of the low-coherence light source used
for imaging. In this aspect, OCT is different from cSLO,
where the depth of focus can be limited by the numerical aperture of the pupil
of the eye. For a source of Gaussian spectral distribution, the axial
resolution, Δz, is
|
|
(8) |
where Δλ is the full
width at half maximum (FWHM) wavelength range of the light source, and λ0
is the center wavelength. [4] Commercial
“standard-resolution” OCT instruments use superluminescent
diodes (SLD) emitting light centered at 830 nm and 20-30 nm bandwidth, thus
resulting in a ~10 µm axial resolution in the retina [15].
Ultrahigh-resolution OCT imaging (UHR OCT) [16, 17] achieves better axial resoulution of 2-3 µm
thereby enabling visualization of intraretinal
structures. This advance was first demonstrated using ultrabroad-bandwidth,
solid state femtosecond Titanium:sapphire
lasers [18, 19] instead of the traditional SLD. Ti:sapphire
lasers are capable of providing FWHM of 140-160 nm and in some cases over 250
nm. Further, a frequency-doubled Nd:YVO4, 1.8 W laser (Excel, Laser Quantum) was
reportedly integrated into the resonator layout, and a prototype of a prismless Ti:sapphire laser of
260 nm bandwidth at FWHM, 6.5 femtosecond pulse duration was developed, for a
wavelength range of 640-950 nm. [20] Femtosecond laser technology
achieved unprecedented resolution, but is expensive, being suitable mainly for
fundamental research. More recently,
cost-effective, broad-bandwidth SLD sources have been developed that approach
resolutions achieved by femtosecond lasers [21-24]. They comprise multiplexed SLDs
consisting of two or three spectrally displaced SLDs, combined to synthesize a
broad spectrum. With very wide-spectrum sources emitting over nearly 100 nm
wavelength range, OCT has achieved sub-micrometer resolution. Despite the
disadvantage of spectrally modulated emission spectra producing sidelobes in the coherence function and image artifacts,
multiplexed SLDs are the light source of choice for many commercial
instruments, providing 5-8 µm axial resolution [15].
Figure 3
shows pathology examples detected with the TD OCT instrument STRATUS OCT ™, courtesy of Carl Zeiss Meditec. The left panel shows a macular hole with posterior vitreous detachment. The right panel presents
pigment epithelial detachment. The structures of the retina are color-coded.
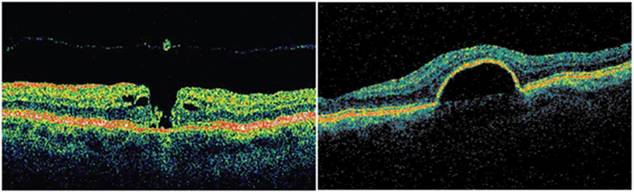
Figure 3
Optical
Coherence Tomography in the Fourier domain (FD OCT, Spectral Radar, Spectral
Domain OCT). It can be shown that the cross spectral density
function of two waves (in this case the reference and the sample wave) can be
obtained as the Fourier transform of the cross-correlation function: [1]
|
|
(9) |
where k=2π/λ0 is the wave number,rij(ΔL) are the cross-correlation
functions of the two waves, rij(ΔL)
=cτ, τ being the time delay
corresponding to the round-trip optical path length difference between the two
arms. [7] The amplitude
of the spectrum of the backscattered light,
I(k), can
be measured for different wavenumbers k
using a spectrometer. The inverse Fourier transform of the measured spectral
intensity gives theoretically the same signal as obtained by low coherence
interferometry, providing a function of the depth for each point, without a
moving reference mirror: [1, 25, 26]
|
|
(10) |
In fact, similar to (6), the total interference
spectrum I(k) for a scatterer at a distance
z can be calculated as: [1]
|
|
(11) |
where S(k) is the spectrum
of the source. The useful signal C (the middle convolution term) is the
scattering amplitude a(z), i.e. the strength of the scattering
versus the depth of the sample. The first convolution is the Fourier
transformation of the source spectrum located at z=0, and the last convolution stands for the autocorrelation terms,
describing the mutual interference of the scattered elementary waves. [1]
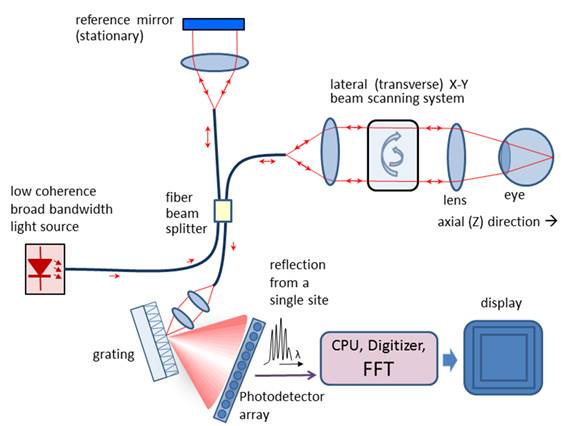
Figure 4
Thus, compared to TD OCT, with FD OCT
only the transversal scanning procedure remains. Figure 4 shows a typical
fiber-optic implementation of the Fourier domain OCT. Similar to TD OCT, a
broad bandwidth source is used. In contrast to TD OCT, the slow mechanical
depth scan is replaced by a spectral measurement consisting of diffraction
grating and photodetector array (here a CCD). The signal is measured in the spectral domain and
then the Fourier transform delivers the scattering profile in the spatial domain. The interference spectrum I(k) for a single scatterer
at a certain distance from the reference plane
z1 is a cosine
function multiplied by the source spectrum
S(k). The Fourier transform
delivers the location of the peak at that frequency that corresponds to the scatterer location.
With FD OCT, the measurable axial range is limited by the resolution of
the spectrometer. It has been shown [1] that the maximum resolvable depth is
|
|
(12) |
Where dλ denotes the wavelength sampling
interval of the spectrometer.
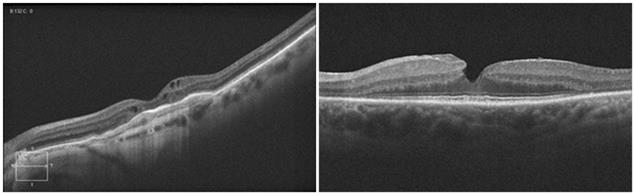
Figure 5.
Figure 5 shows pathology examples detected with the CIRRUS HD-OCT ™ FD
OCT, courtesy of Carl Zeisss Meditec.
The left panel shows age-related
macular degeneration. The right panel presents a lamellar macular hole. Figure 6
shows photoreceptor disruption of the retina (right), observed in a section
marked with a green line on the transversal image (left). The image was
obtained with the SPECTRALIS® FD OCT from Heidelberg Engineering. This
instrument has enhanced the role of FD OCT by integrating it with a cSLO. Courtesy of Heidelberg Engineering.
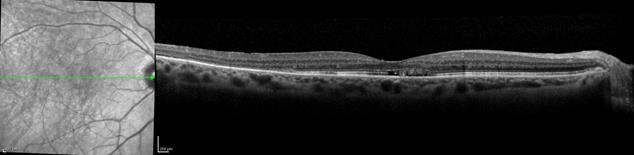
Figure 6
Swept
Source Optical Coherence Tomography (SS OCT, Wavelength Tuning)
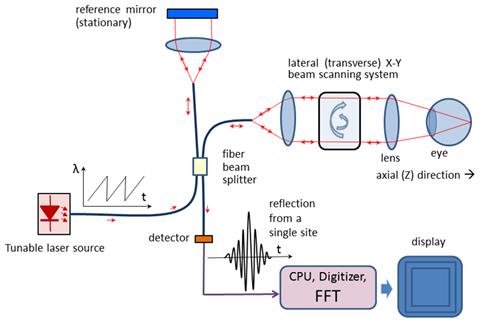
Figure 7
In Swept Source OCT (Figure 7) the wavelength-dependent
intensity data are not acquired simultaneously by using a broadband light
source and a spectrometer. Instead, the wavelength of the source is being
tuned, and a single photodetector is used, recording wavelengths sequentially.[27] The light
intensity at the photodetector at wavelength
λ of the tunable laser can be calculated as: [28]
|
|
(13) |
where Is and Irare the intensities reflected from the sample
and the reference arm, respectively, and ΔΦ is the phase difference
between the two beams: [1]
|
|
(14) |
with k being the
wavenumber corresponding to
wavelength λ. The phase difference ΔΦ
changes with the wavenumber, causing the intensity at the photodetector
to change with a frequency: [1]
|
|
(15) |
The above equation shows that the signal
frequency at the detector is directly proportional to the tuning rate of the wavenumber dk/dt and the
path difference L. With a constant dk/dt (wavelength λ being a ramp), L
can be calculated by means of Fourier transform of the time-dependent intensity
recorded at the photodetector.
Fourier-transforming the time-dependent beat signal yields the sample
depth structure. With other words, the magnitude of the beat signal defines the
amplitude reflectance while the beat frequency defines the depth position of
light scattering sites in the sample. [1]
Polarisation Sensitive Optical Coherence Tomography
(PS OCT)
Originally, the emphasis of OCT has been
the reconstruction of 2D maps of changes of tissue reflectivity, with depth
information. However, in 1992 Hee et al. [29] reported the first OCT system capable of measuring
also changes in the polarization state of light (birefringence). In 1997, the first polarization-sensitive
(PS) images of biological tissue (bovine tendon) were presented, examining also
the effect of thermal damage on collagen birefringence. [30] A further
theoretical contribution to the determination of depth-resolved Stokes
parameters of backscattered light using PS OCT was made two years later by the
same authors. [31] Thus, PS OCT
became a functional extension that takes advantage of the additional
polarization information carried by the reflected light. In the meantime it had
become known that several ocular structures possess birefringent properties. In
the retina these are the RNFL around the optic disc [32], which can help in the diagnostics of glaucoma [33], and the Henle fiber layer around the fovea [34], which can be used for detection of macular defects.
As reported in [35], the optic nerve head is surrounded by the
birefringent sclera rim, which may be used as a landmark in studies of optic
disc anatomy. In addition, a
polarization scrambling layer is located near the retinal pigment epithelium
(RPE) which may become useful in the diagnostics of age-related macular
degeneration (AMD) [36]. The main advantage of PS OCT is the enhanced
contrast and specificity in identifying structures in OCT images by detecting
induced changes in the polarization state of light reflected from the sample. Moreover,
changes in birefringence may indicate changes in functionality, structure or
viability of tissues. [37]
Birefringence changes the polarization
state of light by a difference (Δn)
in the refractive index for light polarized along, and perpendicular to the
optic axis of a material. The difference in refractive index introduces a phase
retardation δ between orthogonal
light components that is proportional to the distance traveled through the
birefringent medium: [37]
|
|
(16) |
A simplified configuration of a PS OCT (time-domain)
is shown in Figure 8. It is based on early open-air designs. [29, 31, 37, 38] Linearly polarized light
(produced by either a laser diode, or a superluminescent
diode and a polarizer) is split into reference and sample arm by a
non-polarizing beam splitter (NPBS).
Light in the reference arm passes through a zero-order quarter-wave
plate (QWPr) with its slow-axis oriented
at 22.5⁰ to the incident horizontal polarization. After reflection from
the reference mirror, the light is returned through QWPr , now
linearly polarized at 45⁰, providing equal reference beam power in the
two orthogonal directions (vertical and horizontal). Light in the sample arm
passes through another quarter-wave plate, (QWPs) oriented at 45⁰
to the incident horizontal polarization and through focusing optics, producing
circularly polarized light incident on the sample. Light reflected from the
sample has generally elliptical polarization, determined by the birefringence
of the sample. The reflected light passes through the QWPs again.
After recombination in the detection arm, the light is split into its
horizontal (p) and vertical (s) linear polarization components by a polarizing
beam splitter PBS, and is then measured by corresponding detectors. The two
photodetector signals are demodulated separately, to produce a two-channel scan
of reflectivity versus distance. Buy using a PBS and quarter-wave plates, and detecting in
two orthogonal linear polarization modes, this design is made sensitive to
phase retardation and measurements are independent of sample axis rotation in
the plane perpendicular to the sample beam. [29]
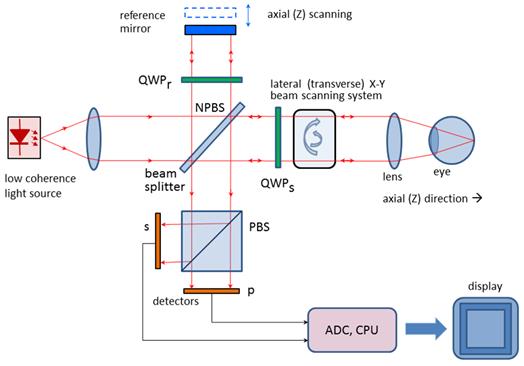
Figure 8
Several groups have reported also
fiber-based PS-OCT systems [39-41]. Compared to open-air systems,
fiber-based PS-OCT are easier to construct. Yet, in a fiber-based system,
maintaining the polarization state in the fiber is a challenge, because of
stress in the fibers and a non-circular shape of the fiber core. Further developments
include Spectral Domain PS OCT where, just as in standard FD OCT, the reference
mirror is stationary and the photodetectors (now a pair) are replaced by a pair
of spectrometers. This led to a
significant increase of speed [42, 43]. More recently, an even faster, Swept Source PS OCT was reported [44] achieving a 350 kHz A-scan rate.
It should be noted that also the cornea
is birefringent. This means that a beam probing the retina, be it initially of
circular or linear polarization, will have elliptical polarization after
passing through the cornea. A similar
problem arises in scanning laser polarimetry, discussed earlier, where using a
variable retarder helped compensate individual corneal birefringence. [45] An interesting
approach was taken by Pircher et al. [40] who report a software-based corneal birefringence compensation that
uses the polarization state of light backscattered at the retinal surface to
measure corneal birefringence (in terms of retardation and axis orientation)
and then compensate corneal birefringence numerically.
An international group [46] recently reported a PS OCT based method to quantify
the double pass phase retardation induced strictly by the Henle fiber layer. On
three patients, the study showed elevated double-pass retardation of 20⁰-to-23⁰
occurring at an average retinal eccentricity of ca. 1.8⁰ (range 1.5⁰
to 2.25⁰). The method was also able to determine the fast axis of
retardation. These results were consistent with previous knowledge of the
radial pattern of Henle fibers.
Birefringence changes polarization in a
predictable manner, which can be described by either the Mueller [47] or Jones [48] matrix of a linear retarder. A good review of PS OCT is given in [41]
The above material is an
excerpt from the following review article:
Gramatikov, B. Modern Technologies for retinal Scanning and
Imaging. An Introduction for the biomedical Engineer.” An invited review, Biomedical Engineering OnLine, 2014, 13:52; DOI:
10.1186/1475-925X-13-52. Published April 29, 2014.
http://www.biomedical-engineering-online.com/content/13/1/52
References
10. Huang, D., et al., Optical
coherence tomography. Science, 1991. 254(5035):
p. 1178-81.