Birefringence-Based Central Fixation Monitor with No Moving Parts
 For the purpose of vision screening we
developed an eye fixation monitor that detects the fovea by its unique radial
orientation of birefringent Henle fibers. Polarized near-infrared
light is reflected from the foveal area in a bow-tie
pattern of polarization states similar to the Haidinger
brush phenomenon. In contrast to previous devices that used scanning systems,
this instrument uses no moving parts. It rather utilizes four spots of linearly
polarized light - two aligned with the “bright” arms, and two aligned with the
“dark” arms - of the bow-tie pattern surrounding the fovea. The light reflected
from the fundus is imaged onto a quadrant photodetector,
whereby the circular polarization component of the polarization state of each
reflected patch of light is measured. The signals from the four photodetectors are amplified, digitized, and analyzed. A
normalized differential signal is computed to detect central fixation. The
algorithm was tested on a computer model, and the apparatus was tested on human
subjects. This work demonstrates the feasibility of a no-moving-parts fixation
monitor.
For the purpose of vision screening we
developed an eye fixation monitor that detects the fovea by its unique radial
orientation of birefringent Henle fibers. Polarized near-infrared
light is reflected from the foveal area in a bow-tie
pattern of polarization states similar to the Haidinger
brush phenomenon. In contrast to previous devices that used scanning systems,
this instrument uses no moving parts. It rather utilizes four spots of linearly
polarized light - two aligned with the “bright” arms, and two aligned with the
“dark” arms - of the bow-tie pattern surrounding the fovea. The light reflected
from the fundus is imaged onto a quadrant photodetector,
whereby the circular polarization component of the polarization state of each
reflected patch of light is measured. The signals from the four photodetectors are amplified, digitized, and analyzed. A
normalized differential signal is computed to detect central fixation. The
algorithm was tested on a computer model, and the apparatus was tested on human
subjects. This work demonstrates the feasibility of a no-moving-parts fixation
monitor.
Introduction
In the late 1980s, human foveal birefringence was measured in vivo with Mueller-matrix ellipsometry. 1 In the early 1990s, the birefringence of the retinal nerve fibers was utilized by Dreher et al. 2 to measure the thickness of the nerve fiber layer. On hearing Dreher’s presentation in 1991, Guyton reasoned that the birefringence of the nerve fibers surrounding the human fovea (Henle fibers) might be used to detect their strict radial geometry. Such a technique could be used to monitor foveal fixation and thus to detect proper alignment of the two eyes in infants and young children. After prolonged experimentation, he reported implementation of this technique in 2000. 3
Using the optics of the eye in an auto-conjugate arrangement, our first instruments employed a circular scanning system. 3-5 When the eye fixated and focused on the target, the light reflected from the retina was automatically focused by the eye back to the source, where it was deflected by a beam splitter and measured.
Polarized near-infrared light is reflected from the foveal area in a bow-tie pattern of polarization states; the pattern is similar to the faint pattern observed surrounding the point of fixation when a subject views a clear background through a polarized filter (the Haidinger brush phenomenon 6). With our previous instruments, the foveal area was probed with a circular scan of frequency f. When the eye fixated on a point at the center of the circular scan, the double-pass polarization state of the light changed at twice the frequency of the scan (2f). With paracentral fixation, the change in the polarization state was only at the frequency of the scan (f).
We subsequently developed and reported a binocular portable eye fixation monitor for early detection of strabismus in children. 4, 7 In this personal computer (PC)-supported device, a point source of polarized near-infrared light was imaged onto the retina and scanned in a 3º diameter circle. Reflections were analyzed by differential polarization detection, employing a polarizing beam splitter for each eye, with measurement trains obtained several times each second. The detected signal was predominantly 2f during central fixation, and f with paracentral fixation. The screener detected misalignment of the eyes of subjects of all ages, including young children. This method, however, required a rapidly spinning motor, which added noise and vibration and which was generally of limited life. To avoid these problems, we have explored the feasibility of a no-moving-parts version of the instrument using a four-quadrant photodetector. This eye fixation sensor has allowed precise detection of central fixation in five subjects.
Methods
Instrument design
|
a |
b |
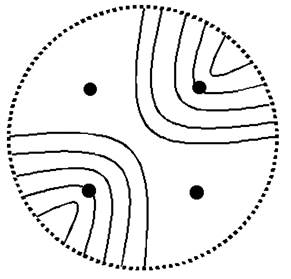
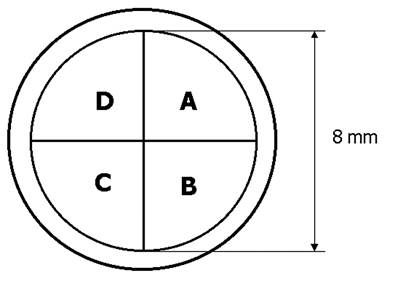
Fig. 1 Principle of the birefringence-based eye fixation monitor with no moving parts: each quadrant photosensor of the 4-quadrant photodetector receives reflected light from the respective patch of light within the arms of the bow-tie pattern.
a) Bow-tie pattern of polarization states surrounding the fovea, and the four spots of light aligned with the arms of the pattern
b) Four-quadrant photodetector (Centrovision QD50-0) oriented to receive reflected light from the four illuminated patches
The new instrument utilizes four spots of vertically linearly polarized light - two aligned with the “bright” arms, and two aligned with the “dark” arms, of the bow-tie pattern of polarization states of the light reflected from the fovea (Fig. 1). The four spots are produced from a single 780 nm, 100 mW laser diode using a multi-faceted prism (Fig. 2). The laser output is modulated by a square wave (f=140 Hz) to improve the signal-to-noise ratio. A near-infrared wavelength was selected to minimize reflex pupillary constriction and thus loss of power, 8 and to maximize spectral reflectance compared with visible wavelengths. 9, 10 Safe light levels were used at all times. 11
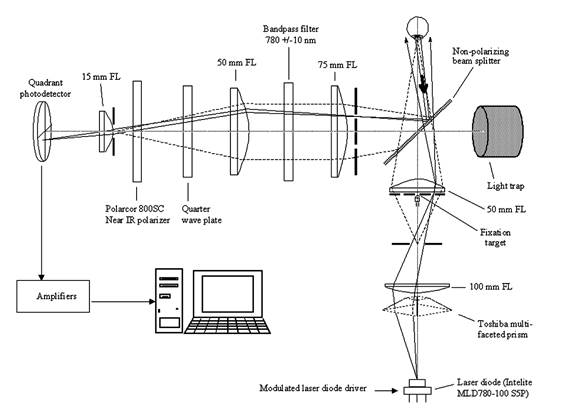
Fig. 2 Instrument design, showing the illumination and detection light paths for one of the four spots of light, not to scale
The light reflected from the fundus travels through a quarter-wave plate and a polarizer, and is then imaged onto a quadrant photodetector of 8mm diameter, whereby the circular polarization component of the polarization state of each reflected patch of light is measured (Fig. 3). In the Stokes vector representation of the polarization state, S = {S0, S1, S2, S3}, S3 represents the differential measurement of the circular polarization component (right-handed circular polarization minus left-handed circular polarization). 12, 13 In our device we measure the circular polarization component by first rotating the polarization states on the Poincaré sphere 90º by means of the quarter-wave plate, and then measuring the linear polarization along the S1 axis using a polarizer in front of the detector. Rather than obtaining the differential measurement along the S1 axis, which would require a polarizing beam splitter and two detectors, we measure using only one polarizer and one detector for each of our four patches of light. As explained later, we then mathematically obtain a spatial differential measurement by subtracting the signals from the patches in the “dark” arms of the bow-tie pattern from the signals from the patches in the “bright” arms. The double-pass corneal birefringence can interfere with this measurement, and this will be analyzed later .
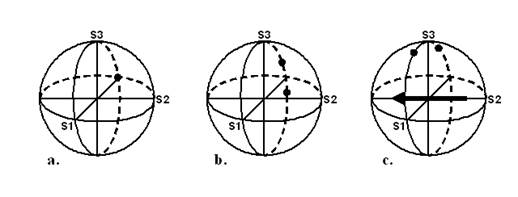
Fig. 3 Poincaré sphere representations of the basic polarization states used. a. Input polarization is linear and vertically oriented, represented as S1 = -1. b. The upper dot represents the polarization state of the patches of light reflected from both “bright” arms, and the lower dot represents the polarization state of the patches of light reflected from both “dark” arms. Note that it is the circular polarization component of these states that is maximally different (separated primarily in the S3 direction). c. A quarter-wave plate has rotated all the polarization states 90° about its fast axis (represented by the eigenvector in the equatorial plane), so that the differences in the circular polarization component can now be conveniently measured along the S1 axis.
The fixation target is a small, translucent “smiley face” that is rear-illuminated with a white-light LED. This fixation target is located in the center of a square whose corners are the four faintly red light spots seen by the test subject. The four signals from the four photodetectors are amplified, filtered, and transmitted to a PC for analog-to-digital conversion (using a 200 ms epoch length) and further digital analysis (Fig. 4). Signal processing includes mainly band-pass digital filtering at the modulation frequency of 140 Hz, synchronous signal averaging of 28 waveforms, and background subtraction, for each of the four channels. The number of waveforms analyzed corresponds to the number of times the measurement cycle of 7.14 ms (140 Hz) is contained in the 200 ms epoch. Software was written by us in C language (CVI, National Instruments) and includes a graphical user interface, data acquisition, signal analysis, and routines for signal and trend visualization, plotting, and signal statistics.
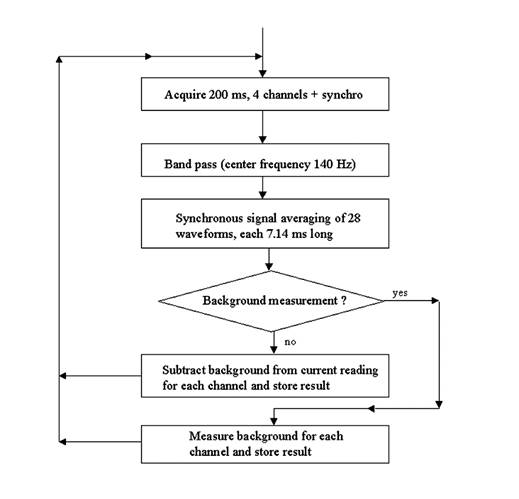
Fig. 4 Digital signal processing algorithm (simplified)
The illuminated area at the surface of the eye is approximately 30 x 30 mm to allow for movement of the head during fixation in anticipation of future vision screening applications. 3-5 Background noise is caused by lid and facial reflections and by internal instrument reflections. The amplitude of the noise is approximated by obtaining a measurement with the eyes closed. This background signal is collected prior to each set of fixation measurements, stored separately for each channel, and subtracted from the fixation readings.
Computer
model of the four-quadrant fixation monitor
In order to optimize the detection algorithm, we developed in MATLAB a mathematical model of the fixation monitor signals (Fig. 5 a,b). The model represents an idealized two-dimensional spatial intensity profile of the polarization-altered light reflected from the fundus, after passing through the quarter-wave plate and polarizer overlying the detector. The signal in each detector quadrant is calculated by integrating the light intensity point-wise across the area captured by each particular detector quadrant. Since the optical design uses four patches of light on the retina, the model uses a mask, thus sensing only light reflected by the four patches directly illuminated by the laser. All other parts of the retina are assumed not to contribute to the signal. Each patch of light always falls in the middle of a quadrant, but can be reflected from any part of the fovea or parafovea depending on where the eye is “fixing.” For simplicity, this model takes into account some blurring on the retina due to imperfect imaging on the single pass into the eye. It does not take into account additional blurring that may occur on the return path back out of the eye. The model rather behaves as if a four-quadrant detector were placed immediately above the retina on the return path.
|
a |
b |
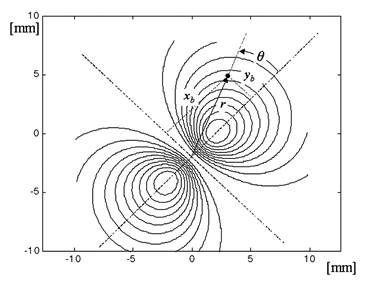
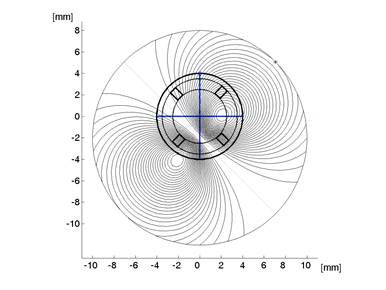
Fig. 5 The mathematical model
a) An idealized 2D spatial intensity profile of the light reflected from the fundus, after passing through the quarter wave plate and polarizer (1 degree of visual angle = 1.96 mm at the photodetector).
b) An idealized 2D spatial intensity profile of the light reflected from the fundus, after passing through the quarter wave plate and polarizer, and falling on the plane of the quadrant photodetector. The signal in each detector quadrant is calculated by integrating the intensity signal point-wise for the illuminated (square) area corresponding to each patch of light. In this particular case, the eye is looking 1 degree downwards from the center, and therefore the center of the fovea is shifted by 2 mm downwards with respect to the center of the photodetector. There is no horizontal displacement.
The bow-tie distribution of light intensities, upon passing through the polarizer overlying the quadrant detector, is shown in Fig 5a. This assumes strict radial orientation of the Henle fibers, which is indeed the case within the central 5º centered on the fovea. 14 It was modeled with a cos2(q) function where q is the azimuth with respect to the fast axis of the Henle fiber birefringence. To achieve attenuation in the regions away from the center, this cosine function was modulated with an exponential radial function of the shape shown in Fig. 6, derived from previous measurements in our lab.15 The overall bow-tie light intensity function used (FB) was
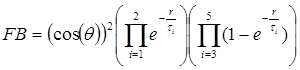 (1)
(1)
where q is the azimuth relative to the fast axis of the Henle fiber birefringence, q=atan(yb/xb), and r = (xb2+yb2)½ is the distance from the origin of the bow-tie distribution in millimeters, on the same scale as the bow-tie image on the surface of the photodetector. The exponents that give the closest match to the profile shown in Fig. 6 are as follows: τ1 = 3.7, τ2 = 50.0, τ3 = 0.6, τ4 = 5.0, and τ5 = 0.8. The model uses millimeters in the detector plane (1.96 mm/degree of visual angle).
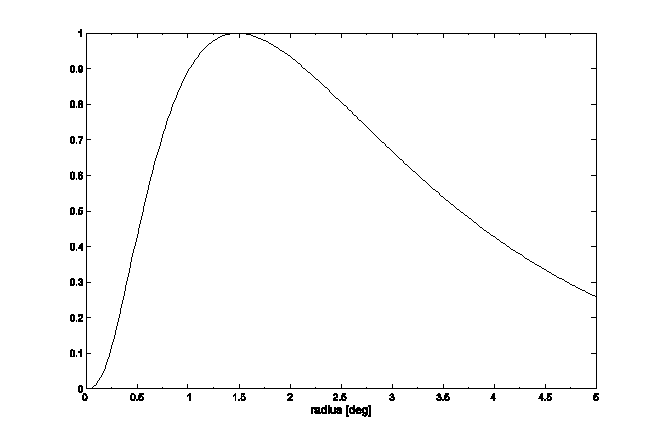
Fig. 6 Change of the strength of the Henle fiber birefringence signal as a function of the distance from the foveal center as measured in the plane of the photodetector (1 degree of visual angle = 1.96 mm at the photodetector).
With central fixation, the center of the detector and the center of the foveal bow-tie pattern should coincide. The signals received by quadrants A and C are equal to each other, as are the signals received by quadrants B and D. When the eye looks away from the center (paracentral fixation), the two centers no longer coincide, as shown in Fig 5b, where the eye is looking 1 degree upwards from the center. The signals from quadrants A and C are no longer equal, nor are the signals received by quadrants B and D. Depending on the direction of gaze, different portions of the bow-tie intensity pattern are projected onto the four quadrants of the photodetector.
In the model, the center of the bow-tie intensity pattern can be positioned at any point in the plane of the photodetector. For each position of the bow-tie center (point x,y) the model yields a set of signals [A, B, C, D] corresponding to the signals received from the four detector segments of the four-quadrant photodetector.
The central fixation equation
If A, B, C and D are the signals from the four-quadrant photodetector, counted in clockwise direction (Fig. 1), with A and C corresponding to the areas yielding higher intensities than areas B and D, then a differential signal (Diff) is obtained by subtracting the signals of the anticipated lower intensity quadrants from those of the higher intensity quadrants:
Diff = (A + C) – (B + D)
In this formula, all four signals obtained from human subjects are used after subtraction of background. Normalization is applied in order to eliminate the influence of individual differences in fundus reflectance, and to adjust for intensity variation due to corneal birefringence. The normalized differential signal (ND) is:
![]() ( 2 )
( 2 )
The signal ND is highest with central fixation, where A and C are at a maximum positive and B and D are at a maximum negative, thus detecting central fixation when the signal exceeds an empirically determined threshold.
|
a |
b |
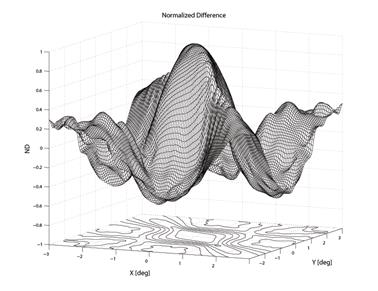
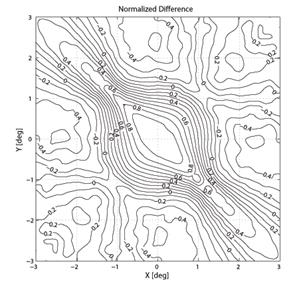
Fig. 7 Result of the model for the normalized difference ND as a function of the distance between foveal origin and the center of the four-quadrant photodetector. The distance is in degrees of visual angle.
To create a spatial representation, ND was plotted in the X and Y directions away from center of the bow-tie pattern in 0.25º (visual angle) increments, with interpolation (Fig. 7, 8). The output of the mathematical model of the fixation monitor is plotted in Fig. 7, showing ND at each X- and Y-position of the bow-tie light intensity pattern with respect to the detector. The ND was calculated from the set of the quadrant signals A, B, C and D, according to (2). The same type of plot, obtained from signals A, B, C and D using equation (2) for central and paracentral fixation from data from a representative subject (#1 in the table), is shown in Fig. 8.
|
a |
b |
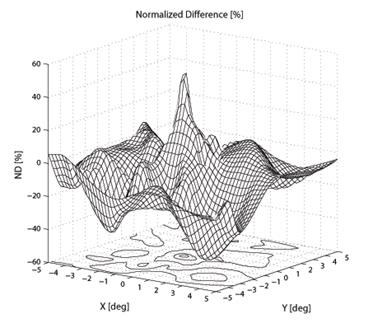
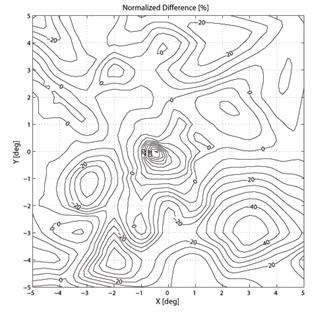
Fig. 8 The normalized difference ND as a function of the direction of gaze of a human eye. The measurements were done using a 2D eccentric viewing scale. The contour lines in (b) are at 5% intervals.
Human subjects
Five adults (three male and two female), aged 23-60, were tested. The study was approved by the Institutional Review Board for all measurements described here, and written consent was obtained properly in writing from each subject. The subjects had no history of eye disease and had corrected visual acuity of 20/20 or better in the tested eye.
Collection and analysis of human central fixation data
 To
characterize the signals obtained from human eyes, a two-dimensional eccentric
viewing scale, graduated in degrees of visual angle, was reflected into the
light path of the fixation detector via 1-mm-thick lantern slide cover slip
serving as a beam splitter. The scale was centered on the central
fixation point, allowing the subject to fixate on any intersection of the grid,
at known coordinates relative to the center of the four laser spots. Each
measurement was background-corrected, and the average of 5 measurements was
used for each point. Points with large variance within the measurement set were
discarded and spatially interpolated during plotting. For each node (1 x 1
degree grid intersection), the average ai = [ Ai
Bi Ci Di ] was recorded, thus
obtaining data from the 11x11=121 main grid nodes. In addition, data
from the central region within a radius of 2°
were collected using half-degree grid spacings. The ND was calculated
using (2), and plotted as an X-Y two-dimensional distribution.
To
characterize the signals obtained from human eyes, a two-dimensional eccentric
viewing scale, graduated in degrees of visual angle, was reflected into the
light path of the fixation detector via 1-mm-thick lantern slide cover slip
serving as a beam splitter. The scale was centered on the central
fixation point, allowing the subject to fixate on any intersection of the grid,
at known coordinates relative to the center of the four laser spots. Each
measurement was background-corrected, and the average of 5 measurements was
used for each point. Points with large variance within the measurement set were
discarded and spatially interpolated during plotting. For each node (1 x 1
degree grid intersection), the average ai = [ Ai
Bi Ci Di ] was recorded, thus
obtaining data from the 11x11=121 main grid nodes. In addition, data
from the central region within a radius of 2°
were collected using half-degree grid spacings. The ND was calculated
using (2), and plotted as an X-Y two-dimensional distribution.
![]() (3)
(3)
For our five test subjects, we wished to compare the predicted output from our model to our actual measurements. This could be done only if we knew their individual corneal birefringences. To measure the corneal birefringence in terms of retardance and azimuth of each subject, we utilized the commercial GDx-VCC instrument (Carl Zeiss Meditec), available in the authors' institution. The GDx, mainly used in glaucoma diagnosis, measures the retinal nerve fiber layer (RNFL) thickness , which is proportional to the measured retardation when polarized light passes through the birefringent RNFL. The VCC (Variable Corneal Compensator) version of the instrument allows individual compensation of corneal birefringence by first measuring the corneal retardance and azimuth, and then adjusting the VCC accordingly, which consists of two linear retarders in rotating mounts. 18 Compensation occurs when the fast axis of the variable retarder is parallel to the slow axis of the measured corneal birefringence, and when the retardance of the VCC matches the measured corneal retardance. We upgraded the device to software version 5.5.0, which gives access to the measured corneal birefringence.
![]()
Results
The output of the mathematical model of the fixation monitor is plotted in Fig. 7, showing ND at each X- and Y-position of the bow-tie light intensity pattern with respect to the detector. The ND was calculated from the set of the quadrant signals A, B, C and D, according to (2). A definite maximum can be seen at central fixation (0,0). For a desired level of precision, a corresponding threshold can be set, above which central fixation can be assumed based on the value of the ND function alone. In the model shown, a threshold of ND = 0.8 permits detection of central fixation with an accuracy better than 0.8°.
Central fixation in the tested human subjects
In the five human eyes tested, ND during central fixation ranged from 0.1968 to 0.3645 (mean = 0.2711, SD=0.0713). The data from all 5 subjects are presented in Table 1. The composite signal-to-noise ratio (measured as the sum of all four channels compared to the composite background noise) ranged from 0.07 to 0.14 (mean=0.104, SD=0.032). During fixation on any paracentral location on the grid, ND was always < 0.07. ND was negative in many paracentral locations. For central and paracentral fixation, the data from a representative subject (#1 from the table) are shown in Fig. 8. The ND distribution exhibits a distinct peak of about 0.5 attributable to central fixation, although shifted by ca. -0.5º in the x-direction, possibly due to a less-than-perfect centration. Note that on the contour plot (Fig. 8b), the value at eye position (0,0) is about 0.23, which is quite close to the ND=0.1968 obtained in a separate measurement for the same subject (#1).
|
Subject |
Measured Normalized Difference NDmeasured |
S/N ratio |
Measured corneal birefringence (with the GDx-VCC)
|
Calculated bow-tie orientation [deg] (RBS model) |
Calculated Normalized Difference NDcalc (4Q model) |
|
|
Retardance [nm] |
Axis [deg] (nasally down) |
|||||
|
1 |
0.1968 |
0.0715 |
19 |
24 |
44 |
1.00 |
|
2 |
0.3038 |
0.0710 |
17 |
7 |
44 |
1.00 |
|
3 |
0.2024 |
0.1075 |
28 |
41 |
44 |
1.00 |
|
4 |
0.3645 |
0.1420 |
30 |
14 |
42 |
0.99 |
|
5 |
0.2878 |
0.1279 |
40 |
27 |
40 |
0.98 |
|
Average |
0.2711 |
0.1040 |
26.80 |
22.60 |
42.8 |
0.99 |
|
STD |
0.0713 |
0.0323 |
9.26 |
13.01 |
1.8 |
0.01 |
Table 1 Measured and predicted values for the test subjects in this study. The second and the third columns represent measurements with our device. The next two columns are corneal measurements taken with the GDx-VCC. The last two columns are predicted values for the bow-tie orientation and for the corresponding calculated ND under ideal conditions, respectively.
The corneal birefringence data measured from the five test subjects with the GDx instrument (as described in section 2.7) are presented in columns 4 and 5 of Table 1 (right eye). The corneal axis (azimuth) is measured in degrees, with nasally downward considered positive. These values, for each subject separately, were inserted into the RBS model, which calculated the bow-tie orientation according to section 2.6, and are given in column 6 of the Table. It can be seen that for these subjects the change of the bow-tie tilt is between -1º and -5º. Similarly, we found for the left eye changes between 0º and 3º, in the mirror image direction. Using the bow-tie orientation from column 6, we ran the four-quadrant model, to calculate the normalized distance NDcalc in column 7. These calculations show that for our test subjects corneal birefringence only minimally influences the ND as a measure of central fixation.
In order to assess the role of corneal birefringence on a larger data set, we applied our RBS model (described under 2.6) to the BPEI data. During simulated central fixation, we scanned along an annulus of 3º around the fovea with a vertically polarized incident beam. The model was run for each of the 143 eyes in the data set (71 right eyes and 72 left eyes of 73 subjects). Since our RBS model expected the corneal fast axis, the following calculations were performed:
CAFA = CASA + 90º (right eye)
CAFA = -CASA + 90º (left eye)
where CASA is a negative value of the corneal slow axis, measured nasally downward for each eye, as in the original data set. The thus-calculated fast axis CAFA was used along with the corneal retardance CR in the computer model 2.6. For each eye, the position of the first maximum of the computed scan signal was identified as angle β, corresponding to the axis of the bow-tie. A 360º scan obtained with the RBS model, with corneal retardance equal to zero, yields a sine wave with its first maximum at β=45º, consistent with a 45º orientation of the bow-tie, as indicated in Figs. 1a and 5a. Fig. 9 a,b shows the distribution of the orientation angle β of the first maximum of the bow-tie relative to 3 o’clock, depending on corneal retardance and azimuth, for the right eyes and left eyes, respectively. The BPEI data were superimposed on a full-grid plot of β(CA,CR), where CA is the slow axis, to stay compatible with previous publications. Clearly, for the majority of eyes, the orientation angle β is in the range 30º-50º , but there are certainly “outliers”. The same distribution is shown as histograms on Fig. 10 a,b, for the right eye and the left eye, respectively. It can be seen that corneal birefringence tends to increase the bow-tie orientation angle in left eyes, and to decrease it in right eyes (which is what we also observed in our 5 subjects). There are 5 out of 71 (7%) right eyes with orientation angle less than 10º, and 9 out of 72 (12.5%) left eyes with orientation angle less than -40º. In fact, the left-most LE case crosses into the next quadrant and can be considered part of the main distribution, in the 80º-90º segment. Our calculations with the four-quadrant model showed that at orientations deviating from 45º by up to ±20º, the normalized difference still displays a positive maximum at central fixation, but loses up to about 25% of its value. Central fixation in such cases is still detectable, at the cost of a reduced threshold. However, the above-noted outliers will be missed by this device.
|
a |
b |
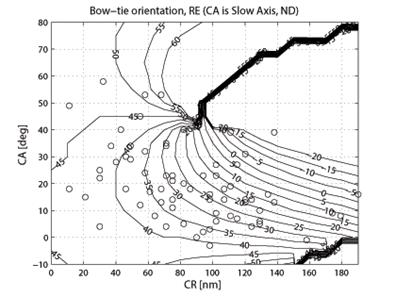
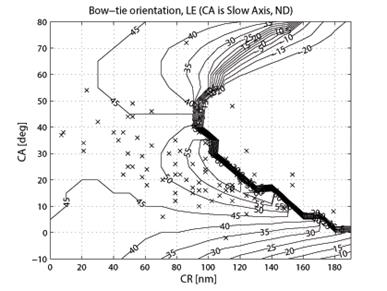
Fig. 9 Bow-tie orientation as a function of corneal retardance and corneal azimuth, with the BPEI data blended in. a) right eye (71 eyes), b) left eye (72 eyes).
|
a |
b |
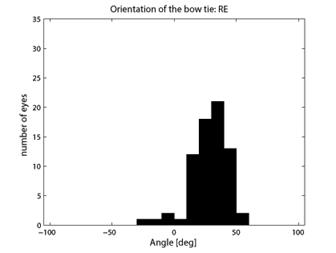
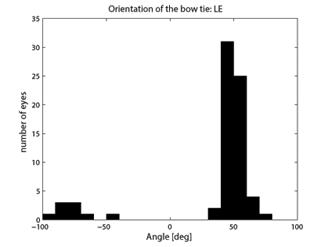
Fig. 10 Distribution of the bow-tie orientation angle from Fig. 9 (BPEI data). a) right eye (71 eyes), b) left eye (72 eyes).
Finding an optimal corneal compensator
In order to reduce statistically the influence of the corneal birefringence, we propose the use of a fixed corneal compensator with a fast axis in the quadrant nasally downward for each eye. Applying the algorithm from 2.8, we obtained Fig. 11, showing the portion of the “good” eyes with brush orientation within ±5º of 45º. There is a relatively broad CR-CA region, for which 74% of all (RE+LE) eyes would fall in the “good” category, with several spots giving 76% coverage. Our algorithm measured a maximum at CR=45 nm, and CA=25º (fast axis, nasally downward), which (just as the other spots) happens to be relatively close to the fixed corneal compensator of the earlier GDx-FCC (60 nm/15º). 18 With the suggested compensator, the full-grid plot of the bow-tie orientation β(CA,CR) was calculated and is plotted on Fig. 12, and the distribution histograms are shown in Fig. 13. Within ±5º of 45º we now have 49 of 71 (69.01%) RE, 61 of 72 (84.72%) LE, and 110 of 143 (76.92%) for both eyes. A liberal ±22º tolerance around 45º gives 69 of 71 (97.18%) RE, 72 of 72 (100.00%) LE, and 141 of 143 (98.60%) for both eyes. These results are a significant improvement, compared to the results calculated without a corneal compensator (Fig. 9 and Fig. 10). The same algorithm should allow individual optimization for each eye, should a different compensator fast axis orientation and/or different compensator retardance be allowed for each eye.
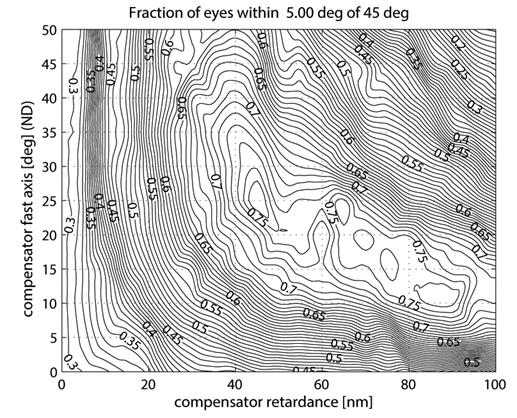
Fig. 11 Calculating an optimal fixed corneal compensator: fraction of eyes (RE+LE) falling within ±5º of 45º bow-tie orientation, as a function of compensator retardance and fast axis azimuth.
|
a |
b |
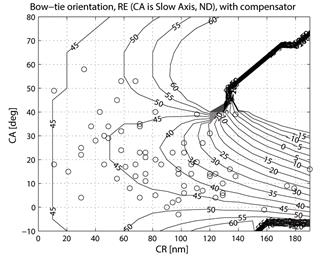
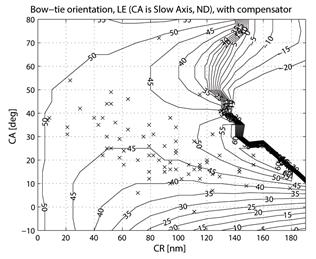
Fig. 12 Expected bow-tie orientation as a function of corneal retardance and corneal azimuth, with an optimal fixed corneal compensator. The BPEI data was blended in. Please compare to Fig. 9. a) right eye (71 eyes), b) left eye (72 eyes).
|
a |
b |
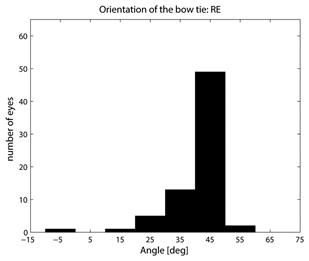
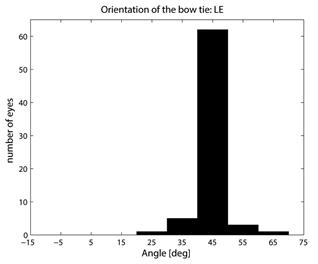
Fig. 13 Distribution of the bow-tie orientation angle from Fig. 12 (BPEI data with an optimal fixed corneal compensator). Please compare to Fig. 10. a) right eye (71 eyes), b) left eye (72 eyes).
Discussion
Our laboratory has previously demonstrated how a polarized light scan of the birefringent foveal area can be used to detect fixation by the fovea of the eye. The present study shows that it is possible to detect this foveal polarization signature without the requirement that the spot of laser light be scanned or moved around the fovea. The no-moving-parts, birefringence-based fixation monitor produced a signal, ND, that peaked during central fixation (Fig. 8), indicating that this approach can be utilized to detect foveal fixation. With the present apparatus, ND>0.15, after background correction, appears to be a good threshold for central fixation. In addition, this method does not need eye-gaze calibration, which is a significant advantage over most other instruments used to monitor or track the direction of gaze.
The computer modeling involving the BPEI data showed that corneal birefringence can adversely influence the precision of this device by changing the orientation of the bow-tie. Although with the majority of eyes the orientation is close enough to 45º to guarantee values above the threshold for central fixation, there are a small number of subjects where the rotation of the bow-tie would be too much for accurate fixation detection. The suggested fixed corneal compensator would improve the precision significantly. A large amount of abnormal ocular torsion, enough to give an abnormal azimuth to the corneal birefringence, could decrease the signal quality, but abnormal ocular torsion of more than 10° is quite rare. The effect of head tilts would produce similar artifacts. However, errors from head tilts are to a certain extent avoidable by either tilting the apparatus to be aligned with the head tilt, or orienting the head to be aligned with the apparatus.
The main difficulty with this device appears to be the low signal-to-noise ratio (S/N ratio) of roughly 0.07-0.14 due to light reflected from the sclera, cornea, and face. The time-synchronous averaging greatly improved the stability of the parameters measured, and the reliability of the fixation and gaze-position measures calculated. But it should also be noted that an unexpected change of background of several percent (i.e. due to a slight movement of the face after the last background measurement) would be incorporated into the eventual signal and would adversely influence measurement accuracy. A “Zorro” mask made of black felt decreased the background signal from facial reflections about three-fold and greatly improved measurement stability in ND-based central fixation applications. Unfortunately, such a mask cannot be used in a clinical pediatric application, which is the primary target application for our device. Another approach to reduce the effect of the reflections from the sclera, cornea, and face would be to modify the system such that the four light spots are fired sequentially, rather than simultaneously – i.e. by using four laser diodes. This would decrease background interference roughly four-fold, because reflections from the face back into the system would be reduced essentially four-fold.
References
1 H. B. klein Brink and G. J. van Blokland, "Birefringence of the human foveal area assessed in vivo with Mueller-matrix ellipsometry", J Opt Soc Am A 5(1), 49-57 (1988).
2 A. W. Dreher, K. Reiter and R. N. Weinreb, "Spatially resolved birefringence of the retinal nerve fiber layer assessed with a retinal laser ellipsometer." Appl Opt 31, 3730-3735 (1992).
3 D. L. Guyton, D. G. Hunter, S. N. Patel, J. C. Sandruck and R. L. Fry, "Eye Fixation Monitor and Tracker", U.S. Patent No. 6,027,216 (February 22, 2000).
4 D. G. Hunter, S. N. Patel and D. L. Guyton, "Automated detection of foveal fixation by use of retinal birefringence scanning", Appl Optics 38(7), 1273-1279 (1999).
5 D. G. Hunter, J. C. Sandruck, S. Sau, S. N. Patel and D. L. Guyton, "Mathematical modeling of retinal birefringence scanning", J Opt Soc Am A 16(9), 2103-11 (1999).
6 S. Duke-Elder, N. Ashton, R. J. H. Smith and M. Lederman, "Ch. XV: Entoptic Observations", in: The Foundations of Ophthalmology, System of Ophthalmology VII, pp. 457, C. V. Mosby Company, St. Louis (1968).
7 D. Nassif, B. Gramatikov, D. Guyton and D. Hunter, "Pediatric Vision Screening using Binocular Retinal Birefringence Scanning", SPIE, Bellingham, WA, 4951, Ophthalmic Technologies XIII, pp. 9-20 (2003).
8 N. Lopez-Gil and P. Artal, "Comparison of double-pass estimates of the retinal-image quality obtained with green and near-infrared light", J Opt Soc Am A 14(5), 961-71 (1997).
9 N. P. Zagers, J. van de Kraats, T. T. Berendschot and D. van Norren, "Simultaneous measurement of foveal spectral reflectance and cone-photoreceptor directionality", Appl Opt 41(22), 4686-96 (2002).
10 A. E. Elsner, S. A. Burns, J. J. Weiter and F. C. Delori, "Infrared imaging of sub-retinal structures in the human ocular fundus", Vision Res 36(1), 191-205 (1996).
11 D. Sliney and M. Wolbarsht, Safety with Lasers and Other Optical Sources., Plenum Press, New York and London (1980).
12 W. A. Shurcliff, Polarized Light: Production and Use, Harvard University Press, Cambridge, Massachusetts (1962).
13 D. S. Klieger, J. W. Lewis and C. E. Randall, Polarized Light in Optics and Spectroscopy, Academic Press, Inc. (1990).
14 S. Duke-Elder, The Anatomy of the Visual System, System of Ophthalmology, pp. 266-269 pp., C.V. Mosby Co., St. Louis (1961).
15 S. N. Patel, "Analysis of foveal birefringence to monitor eye fixation." Master's Thesis, Johns Hopkins University (1995).
16 R. W. Knighton and X. R. Huang, "Linear birefringence of the central human cornea", Invest Ophthalmol Vis Sci 43(1), 82-6 (2002).
17 R. N. Weinreb, C. Bowd, D. S. Greenfield and L. M. Zangwill, "Measurement of the magnitude and axis of corneal polarization with scanning laser polarimetry", Arch Ophthalmol 120(7), 901-6 (2002).
18 Q. Zhou and R. N. Weinreb, "Individualized compensation of anterior segment birefringence during scanning laser polarimetry", Invest Ophthalmol Vis Sci 43(7), 2221-8 (2002).
This material is covered in more detail in the following publication:
Gramatikov
BI, Zalloum OHY, Wu Y-K, Hunter DG, Guyton
D.L. Birefringence-based eye fixation monitor with no moving parts. Journal of
Biomedical Optics. 2006, 11(3):034025-1 - 034025-11,
http://www.ncbi.nlm.nih.gov/pubmed/16822074