Continuous monitoring of central fixation for better
identification of ADHD
There are both clinical and research needs for instrumentation for reliable eye tracking or at least simply for monitoring of eye fixation. Such areas include, but are not limited to, ophthalmology, psychology/psychiatry, and neurophysiology. Eye trackers, gaze monitors, and central fixation monitors can provide objective evaluation of a number of parameters that can aid the diagnosis of different conditions. For example, for diagnosis of attention deficit hyperactivity disorder (ADHD), the clinician is interested in the ability of the test subject to fixate on a given target over a certain period of time in the presence of a distracting stimulus. Fixational stability abnormalities are known to be part of the ADHD syndrome.27, 29 Objective computer methods have been developed to assess attention in the laboratory when presenting stimuli, analyzing response time, latency, commission errors, and omission errors 8, but no robust device for clinical use has yet been developed.
Autism researchers are also interested in studying the fixation behavior of young children. The earliest and most commonly cited manifest behavior in children with autism spectrum disorders is avoidance of engagement with human faces,6, 40 and particularly avoidance of eye contact. 21, 41 3, 5, 21, 23, 28, 41 Autistic children have been shown to demonstrate diminished gaze to the mother’s eyes relative to her mouth.28 Autism and related disabilities are difficult to diagnose, especially in young children with reasoning skills and speech still developing.25 Analysis of gaze behavior can help identify children with such disorders in infancy and early childhood, with the aim of starting early intervention likely to lead to an improved outcome.24, 26, 36
Neurophysiologists and psychiatrists are interested in test subjects’ ability to direct and keep their attention on a visual target. A quantitative assessment of attention and distraction can aid the evaluation of fatigue, stress, vigilance, etc. Studies of psychomotor performance have explored the potential of eye fixation in identifying association/dissociation between the direction of attention and eye movement, indicating that dissociation between eye movement and attention leads to change blindness. 33 Last but not least, non-medical disciplines, such as the advertising industry, are often interested in whether the subject’s attention is attracted and held by a certain object in the visual field.
Various eye trackers have been developed and are commercially available. Most of them are fast, and sufficiently precise over a wide range of the visual field.2, 4, 7, 12, 19, 34, 35 But they generally suffer from one significant shortcoming – the need for calibration. While for many purposes calibration to known directions of gaze is straightforward, there are applications, particularly when working with young children, where calibration is difficult or impossible. Another disadvantage of current eye trackers is that they use information acquired from a reflection from the outer layers of the eye. True detection of the direction of gaze can only be performed by locating the optical projection of the fovea onto the visual scene. The fovea is the most sensitive part of the retina, which is aimed toward the object being observed, and is responsible for sharp central vision.
|
|
||||
Figure 1. Haidinger brush pattern of polarization states and its position relative to the scanning circle during central and paracentral fixation. The scanning circle has a diameter of 3º of visual angle and during central fixation it crosses the two maxima of the polarization cross, which are 1.5º from the center of the fovea. |
|
|||
|
|
|
|||
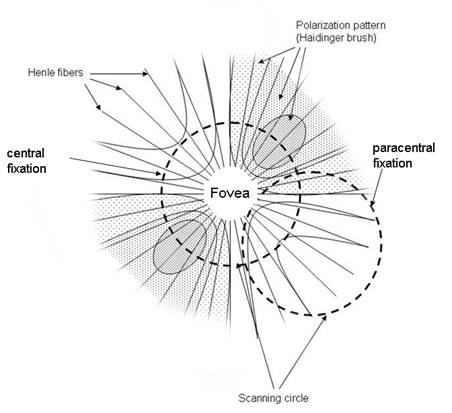
Over the past two decades our laboratory has been developing novel technology for detecting accurate eye alignment by exploiting the birefringence (the property of certain optical media that can change the polarization state of light) of the uniquely arranged, radially symmetric nerve fibers (Henle fibers) surrounding the fovea. The polarized light is made up of two orthogonal components. When these components pass through the Henle fibers, which are a birefringent medium, one component is changed (retarded) with respect to the other. This retardation can be detected by a polarization-sensitive sensor (analyzer). Retinal Birefringence Scanning (RBS) is a technique that uses the polarization changes in the light returning from the eye to detect the projection into space of the array of Henle fibers around the fovea.14, 15, 16 In RBS, polarized near-infrared light is directed onto the retina in a circular scan, with a fixation point in the center, and the polarization-related changes in light retro-reflected from the ocular fundus are analyzed by means of differential polarization detection. Due to the radial arrangement of the birefringent Henle fibers (Figure 1), a bow-tie pattern of polarization states results, centered on the fovea, with maximum and minimum areas of the polarization cross approximately 1.5º from the center of the fovea. A characteristic frequency appears in the obtained periodic signal when the scan is also centered on the fovea, indicating central fixation. In the case of Figure 1, with the eye fixating properly, the fovea is centered within the scanning circle of near-infrared light. The concentric circle of light (diameter of 3º of visual angle) falls entirely on the radial array of Henle fibers, and generates a birefringence signal which is twice the scanning frequency (two peaks and two dips per scan). During paracentral fixation, the scan is decentered with respect to the center of the fovea, and the orientation of the radially arranged nerve fibers changes only once during each single scan, resulting in a main frequency component equal to the scanning frequency. In a binocular configuration, by analyzing frequencies in the RBS signal from each eye, the goodness of binocular eye alignment can be measured, and thus strabismus can be detected. In preliminary studies and in an early prototype, RBS has demonstrated reliable non-invasive detection of foveal fixation, 17 as well as detection of eye misalignment.18 A non-moving-part design was developed11, and its ability to perform eye-tracking after calibration was successfully tested.12 A more recent study has led to the optimization of the parameters of the optical components used in RBS and improvement of the signal-to-noise ratio across a wide population.20
Attention deficit hyperactivity disorder (ADHD) is a common disorder without validated objective markers. Eye movement studies have shown promise in providing objective criteria for identifying the disorder.10 Subjects with ADHD have reduced ability to suppress unwanted saccades and control their fixation behavior voluntarily,32, 37, 39 with signs of impaired response inhibition and variability in motor response.29, 30 According to Gould et al.,10 the large saccades that interrupt fixation provide evidence that children with ADHD not only have difficulty inhibiting responses to anticipated stimuli, but also have difficulty in simply maintaining fixation.
We hypothesize that a modified, monocular, and noise-immune version of our earlier eye fixation monitor may prove useful in screening for ADHD, and possibly for monitoring the course of treatment. We further suspect that this or a similar design will find application in the diagnosis and treatment monitoring of other neurological or psychiatric disorders.
This paper describes work on the development of a device specially designed for continuous monitoring of true central fixation based on foveal birefringence, and reports preliminary results of the device’s use to help identify patients with ADHD.
Optics and optomechanics. The opto-mechanical design of the monocular RBS-based eye fixation monitor is shown in Figure 2. The dashed inset border encompasses the main optical part of the system.
|
|
|
Figure 2: Block diagram of the entire system, viewed from above. |
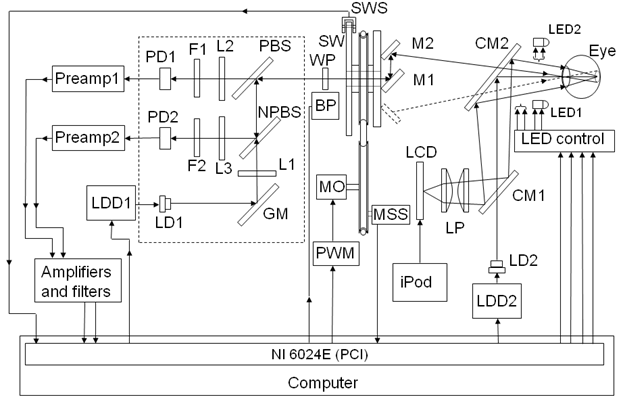
A “scanning” laser diode LD1 driven by a laser diode driver LDD1 produces linearly vertically polarized light at 785 nm, which is deflected by a gold mirror (GM) through a 100 mm biconvex lens (L1) and a non-polarizing beam splitter (NPBS). The light is then reflected by a polarizing beam splitter (PBS) into a scanning unit, which consists of two plane mirrors (M1 and M2) instead of a tilted, spinning concave mirror as used in previous versions 17, 15, avoiding optical degradation of the double-pass image. As the mirrors are spun (fscan = 40 Hz) by a motor MO (12 V, DC) and a belt, the stationary beam is converted into a circular scan, subtending an angle of approximately 3° at the subject’s eye. By the eye’s own optics, the beam is focused onto the retina, with the eye fixating on the image of laser diode LD2, appearing in the center of the scanning circle, and follows the same path back out of the eye after being reflected from the ocular fundus. The polarizing beam splitter PBS separates the polarization-altered light into two orthogonal components. The horizontal polarization component is transmitted, passes through a 100 mm focal length biconvex lens (L2) and a (780± 8) nm bandpass filter (F1) with a full width half maximum (FWHM) of (30 ± 8) nm, before finally reaching one of the two photodetectors (PD1). The vertical polarization component is reflected by the polarizing beam splitter (PBS), and part of the vertically polarized light is directed by the non-polarizing beam splitter towards the second photodetector (PD2) after passing another converging lens (L3) and a bandpass filter (F2) with the same properties.
The speed of the motor is measured with a reflective motor speed sensor (MSS) providing feedback to the computer, which continuously monitors motor speed and controls it over a pulse-width-modulation (PWM) circuit.
The monocular RBS-based eye fixation monitor further incorporates a wave plate (WP) that has been optimized to minimize interference from corneal birefringence in RBS. More precisely, in a previous study, using an algorithm and related computer model in which the polarization changing properties of the whole system were represented, including the retina and cornea, and utilizing a data base of measured human corneal retardances and corneal azimuths, we were able to maximize signal strength while making it largely independent of different values of corneal retardance and corneal azimuth that occur in the population. 20
Laser safety. The scanning laser LD1 is 785 nm, with 50 mW (max) optical power. The fixation (target) laser LD2 is 690 nm, 35 mW (max) optical power, and is modulated (on-off) continuously at a frequency of about 5 Hz, 50% duty cycle. Both diode lasers are driven by the FL 500 laser diode driver (Wavelength Electronics), in continuous wave (CW), constant current (CC) mode. This driver provides feedback voltages proportional to the laser current for each laser. The voltages are fed back to the computer over the analog-to-digital acquisition module, for continuous monitoring by the device’s software in real time, for quality assurance. Special attention was paid to laser safety. Theoretic considerations and experimental measurements show that a 50 mW laser, such as the scanning laser, delivers less than 0.20 mW/cm2 at a distance of 40 cm (distance to the test subject eyes). For the duration of one measurement (0.5 s to 1 s) and for the wavelength used, this irradiance is well below the threshold established by the American National Standards Institute (ANSI) Z-136 safety standard, of 0.46 mW/cm2 for a CW laser for an indefinite period. Therefore, several minutes of measurement time are not a concern from a safety point of view. This assumption is based upon the ANSI Z-136 standard for direct ocular exposures (intrabeam viewing) from a laser beam, as summarized in Sliney 38. For the fixation laser, delivering less than 0.14 mW/cm2 at a distance of 40 cm, similar considerations give a safety exposure limit of ca. 0.30 mW/cm2 for 1000 s, CW. In addition, this laser is rarely used at its full power, and is also modulated.
Fixaton/attention objects. The test subject’s attention is attracted by the attention-drawing, blinking laser diode LD2 accompanied either by two distracting bicolor LEDs flashing randomly on both its sides (each about 5⁰ of visual angle away), or by a computer-generated starfield, displayed as a video on a miniature LCD screen by an iPod nano (Apple), representing the target subsystem. The iPod nano presents a video of bright stars on a black background, moving towards the center of the starfield where a rotating lady bug is located. Importantly, the attention-drawing, blinking fixation light (LD2) appears superimposed on the lady bug and in the exact center of the scanning circle, the two images being merged by the cold mirror CM2. In addition, a distracting video object is presented to the test subject in the form of a small ball appearing occasionally and spinning around the center while changing color, to test the subject’s ability to maintain stable central fixation in spite of distraction.
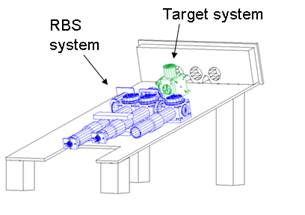
Figure 3 below illustrates the entire device in two views, drafted with AutoCAD (Autodesk; San Rafael) and emphasizing the RBS subsystem and the target subsystem. The drawings do not show the cover. The entire instrument is encased in black Plexiglas. There are only three eye-holes on the front panel for the two eyes, and two cutouts for the nose, thereby avoiding any source of distraction that could interfere with the primary assessment of central fixation on the fixation target over an extended period of time. The nose may be positioned to the left or to the right of the center eye-hole, through which the actual measurement is done. Thus, measurement can be performed on either eye. Black light traps are positioned beyond the two side eye-holes. The subject’s head rests against a rubber bumper, not shown, above the eye-holes in the front panel.31
|
|
|
|
Figure 3 The monocular RBS-based eye fixation monitor, illustrated in two oblique views |
|

Electronics. A simplified block diagram of the electronics is shown in Figure 2. The system uses a PC equipped with a multifunction I/O board NI 6024E by National Instruments. The board provides 12-bit analog I/O, digital input/output lines, and trigger inputs and outputs. The signals from the paired photodetectors (respectively for s- and p-polarization) are pre-amplified (Preamp1 and Preamp2), balanced, and then fed to the analog board (Amplifiers and Filters, Figure 2).
Control of the scanning motor and data acquisition. The scanning motor MO is spun at a speed of 40 revolutions per second (rps) over a pulse-width-modulation (PWM) circuit controlled via an analog output of the PC. An optical reflective motor speed sensor MSS provides feedback with one pulse per revolution. The control loop is closed by the PC in software. In order to enable signal averaging, we pace the ADC with a pulse train coming from the motor, generated by means of a transmissive optical sensor and a sector wheel sensor SWS (125 sectors) serving as an incremental rotary position encoder attached to the scanning unit. This eliminates the influence of short lasting speed fluctuations and guarantees that every sample is taken at a well defined angle of rotation. Thus, inexpensive DC motors can be used instead of heavier, current consuming, and more expensive step motors. With a 125-sector wheel, the data sampling frequency is 5 kHz (125 sectors *40 rps) and every new data sample corresponds to 2.88° (360°/125) of rotation, the sampling interval being 200 µs. Synchronizing the ADC with the scanning system greatly reduces the noise and enables precise signal averaging regardless of fluctuations in motor speed.
Signal conditioning and digital signal processing. The balanced outputs of the paired
photodetectors are subtracted, yielding the differential polarization signal (S1
signal). This signal is amplified, filtered, and transmitted to the PC for analog-to-digital
(A/D) conversion and further analysis by means of software.
The main problem with earlier designs employing RBS has been the very low signal coming back from the retina. Less than 1/1000 of the light going into the eye is reflected back and captured by the sensors. Superimposed signals of electromagnetic (E/M) and optical origin have made the extraction of the birefringence signals challenging. E/M interference is asynchronous with regard to the signals generated by the scanning system, and can be caused by the power line, as well as by diagnostic and therapeutic equipment in the hospital environment. In order to suppress noise outside the frequency band of the RBS signals, we use analog active filters: a 4-th order, 2-stage high-pass Butterworth filter (20 Hz) along with a second order low-pass Butterworth filter (350 Hz). For research purposes, additional flexible high-pass and low-pass linear-phase digital FIR filters of variable cut-off frequencies and impulse response duration were implemented in software. These filters were however never used, because asynchronous noise in this system was sufficiently suppressed by means of signal averaging. In continuous monitoring mode, 400 ms of incoming data were averaged (16 cycles at a motor speed of 40 rps, i.e. each cycle of duration 25 ms) thus achieving 4-fold reduction of asynchronous noise.
In contrast to E/M noise, optical noise is mainly synchronous with the scanning system, as is the useful signal, and for this reason is more difficult to remove. We applied background subtraction, similar to the flat-field correction technique used to improve quality in digital imaging. The goal is to remove artifacts from optical back reflections coming from the inside of the instrument, or from the face of the test subject, as the scan progresses. With the subject’s eyes closed, a 1-D background signal is acquired, averaged over 16 cycles and stored, then subtracted from every averaged incoming signal during regular open-eye measurement. Thus, any further signal is due to the actual birefringence of the eye being detected and not to a systematic error. Performing the FFT (power spectrum) on a short averaged epoch of duration Tscan = 1/fscan = 1/40rps = 25ms decreases the frequency resolution to Δf = 40Hz, but introduces more stability in the running measurements. In this case, only two frequency components are measured: 40Hz (fscan), indicative of lack of central fixation, and 80Hz (2fscan ), indicative of presence of central fixation.
Software. The software was custom-written in C-language (CVI, National Instruments). The most important software modules are: data acquisition, digital I/O and control (including motor and laser control), signal analysis, and graphical user interface. The frequencies of interest are used to identify the presence or absence of central fixation by calculating the normalized fixation ratio:
P2f
RP = ---------------- (1)
P1f + P2f
where P1f and P2f are respectively signal power at frequencies once or twice the scanning frequency fscan. The fixation ratio RP is theoretically close to 1 for central fixation, when mostly doubling of the scanning frequency is observed, due to RBS, and goes toward 0 with paracentral fixation, where only the scanning frequency is present in the signal. Figure 4 illustrates the two fixation states in a controlled experiment, where the test subject was instructed to fixate on the center (RP =0.8), or look 1.5⁰ away from the center (RP =0.1 regardless of the direction of gaze). Data were recorded for 40 s, and the trend of 40 measurements (1 s apart) was plotted. During periods of central fixation, the fixation ratio RP is above 0.8, whereas during off-center gaze it takes values lower than 0.2. A threshold of 0.5 (the average value between 0.2 and 0.8) was used to discriminate between central fixation and paracentral directions of gaze, as in earlier studies. 9, 15
|
|
|
|||
|
a |
b |
|||
|
Figure 4. Normalized fixation ratio Rp in a controlled experiment, where
the test subject was instructed to fixate on the center (RP =0.8),
or look 1.5º away
from the center (RP =0.1 regardless of the direction of gaze). a) central
fixation during measurements 1-23, paracentral
fixation during measurements 24-40. b) central fixation
with the exception of measurements
20-25, during which the subject was instructed to look away from the center |
||||
|
|
The duration of the trend can be freely selected. Although the duration of the examination can be virtually endless, our experience shows that using assessment times longer than one minute are not suitable, because the subject’s ability to concentrate drops as the test progresses. For the ADHD study we used a duration of 40 s.
In order to characterize the subject’s ability to fixate on the target during the examination, two measures were introduced:
a) a Fixation Index, representing the portion of the central fixation measurements relative to the total:
NCF
FI = ------------ (2)
Ntotal
where NCF is the number of measurements with Rp > threshold, and Ntotal is the total number of measurements during the test. For the data shown in Figure 4b, FI = 34/40 = 0.85.
b) a Fixation Variability Index, representing the level of instability of fixation as normalized standard deviation:
STDRp
VI = ------------- (3)
MEANRp
where STDRp stands for the standard deviation of Rp across the trend epoch, and MEANRp is the average Rp for the same period of time.
Device operation: In a first protocol, the subject was instructed to watch the red blinking light in the center, while the distracting lights on both sides were flashed randomly. In a second protocol, the subject was expected to fixate on the lady bug target provided by the iPod nano, with the color ball spinning around the target and changing colors, to distract the subject to lose fixation. The LCD screen is thus used simultaneously as a fixation-stimulating tool (flying starfield converging endlessly toward the center), and as a means of distraction (moving ball). Data were acquired for 40 s typically, unless the patient became too hyperactive, in which case the epoch of data collection was shortened to 30 s. The fixation ratio RP was calculated and plotted continuously in real time, and at the end of data collection RP was displayed as a cumulative score of goodness of fixation (the Fixation Index, FI), along with an indicator of instability, the Variability Index VI.
Human subjects
The device was tested primarily as a tool for detection of attention deficit hyperactivity disorder (ADHD) by assessing the subject’s ability to maintain steady central fixation on a target. Data were collected from 12 normal control subjects (age 16.0±5.5, 7 males and 5 females), and 11 subjects with clinically diagnosed ADHD (age 10.5±2.8, 5 males and 6 females), properly consented, following a protocol approved by the Institutional Review Board (IRB). ADHD patients had been off medication for at least 24 hours prior to the tests. All subjects were instructed to look at the central target only during recording, and ignore any distraction. The total number of test subjects was split into two groups (protocols): a) subjects who were required to look at the simple target (LD2) in the presence of two blinking distracting LEDs on its sides, and b) subjects who were asked to look at the lady bug target in the presence of a video – with a converging starfield, and with a colored ball spinning around the lady bug as a distraction. The first group consisted of 5 ADHD patients (age 10.6±3.2, 2 males and 3 females) and 7 controls (age 16.7±6.3, 4 males and 3 females), whereas the second group consisted of 6 ADHD patients (age 10.3±2.8, 3 males and 3 females) and 5 controls (age 15.0±4.6, 3 males and 2 females).
To attempt to differentiate ADHD patients from normal controls, we wrote a custom program routine for discriminant analysis on the two groups, using a linear fit for the discriminant function, fitting a multivariate normal density to each group, with a pooled estimate of covariance (MATLAB, Mathworks).
In addition, to obtain an idea of how targets and
distraction stimuli influence VI and FI, we acquired data from one ADHD patient
(age 15) and one normal control subject (age 18), using both data collection
protocols with each one of them.
RESULTS
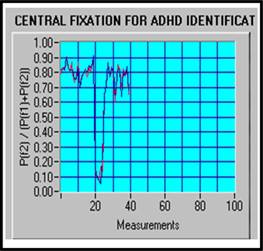
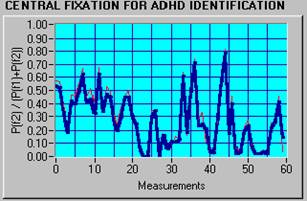
ADHD data are characterized generally by a lower fixation index and more variability, which indicates that ADHD subjects are distracted more easily than normal controls. Figure 5a shows a typical normal subject with FI = 96.67% and VI = 13.6%, while Figure 5b presents a typical ADHD subject with FI = 13.33%, VI = 71.2%.
|
a) FI = 96.67%, VI = 13.6% (Normal) |
b) FI = 13.33%, VI = 71.2% (ADHD) |
|
Figure 5. Normalized fixation ratio Rp and typical values for FI and VI for a normal control (a) vs. an ADHD patient (b). |
|

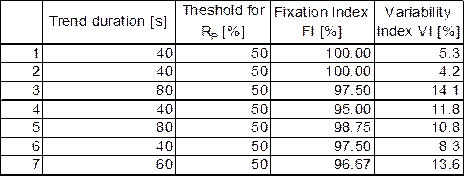
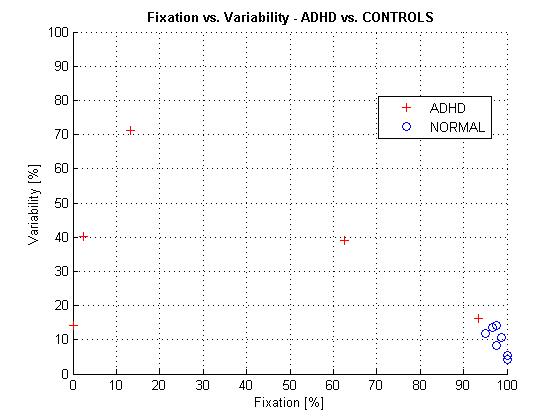
The data from protocol (a) are shown in Tables 1 and 2, and are plotted in Figure 6.
|
|
|
Table 1. Normal subjects, protocol (a) (without video) |
|
|
|
Table 2. ADHD patients, protocol (a) (without video) |
|
|
|
Figure 6 ADHD patients vs. normal control subjects presented in terms of Fixation Index FI and Variability Index VI. Data were acquired without a video (protocol a). |
The data from protocol (b) are shown in Tables 3 and 4, and are plotted in Figure 7. Both protocols show that the data are separable in the FI-VI parameter space.
|
|
|
|
|
Table 3. Normal subjects, protocol (b) (with video) |
|
|
|
|
|
|
|
Table 4. ADHD patients, protocol (b) (with video) |
|
|
|
|
|
|
Figure 7 ADHD patients vs. normal control subjects presented in terms of Fixation Index FI and Variability Index VI. Data were acquired with video (protocol b). |
|
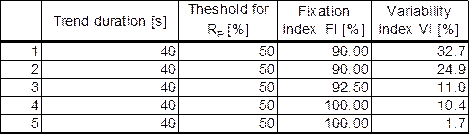
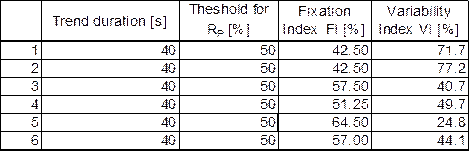
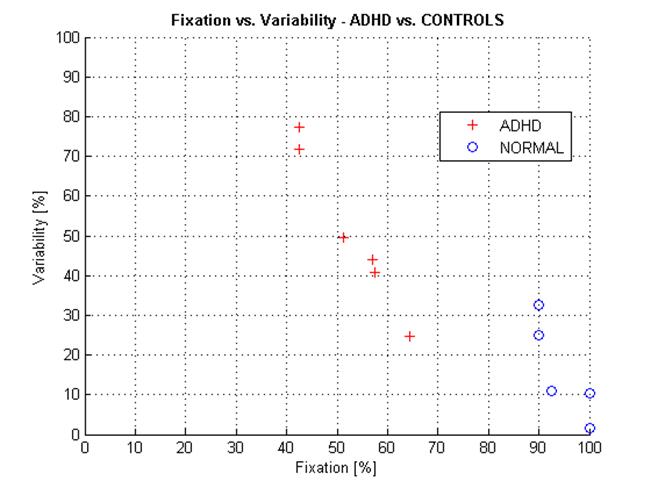
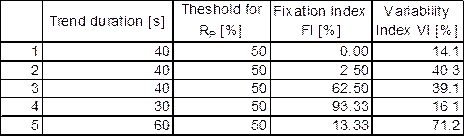
Table 5 shows FI and VI of an ADHD patient and a control subject, with both protocols (with or without a movie) applied on each one of them. It can be seen that the influence of the protocol is minimal both in FI and VI, whose average values do not change much with the protocol. A two-tailed t-test was applied to compare the measurement array for protocol (a) (without movie) to the array for protocol (b) (with movie), for each subject and for each parameter (FI and VI). The t-test probability that the two arrays are samples from populations with the same mean are high for all four pairs of arrays compared, respectively 0.97 and 1.00 for FI, and 0.89 and 0.83 for the FI. Despite the limited number of patients and the limited number of recordings, this simple assessment indicates that the way of presenting the target and the distraction element might not play an important role. This needs to be tested more rigorously in a future study.
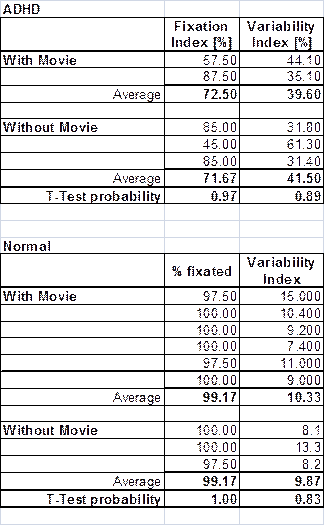
Table 5. Fixation results for an ADHD patient compared with those from a normal control in the presence and absence of video. The t-test shows little difference between the traces recorded with and without a movie for each of the subjects.
Based on the above observation, for the purpose of this limited pilot study, we merged the results from the two protocols into one combined group of 12 normal control subjects and 11 subjects with clinically diagnosed ADHD, and plotted them in Figure 8. The two groups are well distinguishable. We ran discriminant analysis on the two groups, resulting in a discriminant function best separating them:
VI = -63.223 + 1.302 * FI (4)
|
|
|
Figure 8 ADHD patients vs. normal control subjects presented in terms of Fixation Index FI and Variability Index VI. Plot of all ADHD and control subjects (merged protocol a and protocol b). Linear discriminant function: VI = -63.223 + 1.302 * FI. |
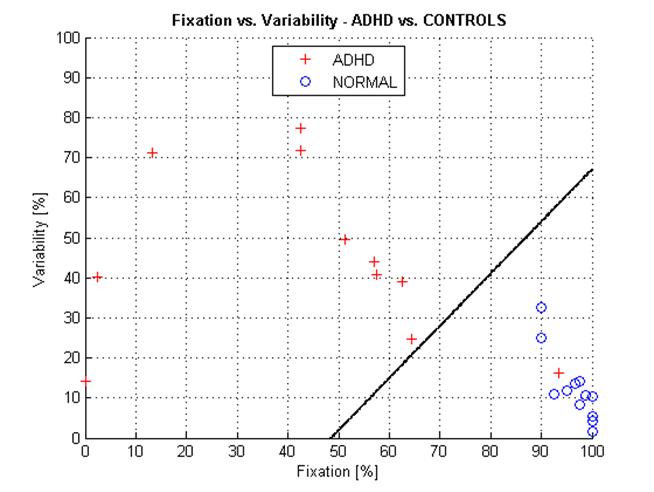
The discrimination (separation) line divides the FI-VI space into two subspaces, each incidence (measurement) being assigned to one of two groups. Measurements above the discriminant line can be considered ADHD, whereas measurements below the line can classified as NORMAL. On this limited data set, we have no false positive, 12 eight true negative (out of 12 controls), and 1 false negative vs. 10 true positive (out of 11 ADHD).
DISCUSSION: Because during central fixation the 3º scanning circle crosses the two maxima and two minima areas of the polarization cross, which are approximately 1.5º of visual angle from the center of the fovea (Figure 1), our technology is able to detect foveal fixation with an accuracy of at least ±1º. This has been shown in an earlier study using a 2-D eccentric viewing scale, graduated in degrees of visual angle and reflected into the light path of the fixation detector, centered on the central fixation point. 11 With the present instrument, as shown in Figure 4a,b, deviation of 1.5º from central fixation causes a drop in the RP ratio readily detectable by the system.
This instrument has advantages over other eye fixation or eye tracking techniques in that it is designed for an unrestrained subject, there are no wires or goggles attached to the head, alignment is not critical, fixation distance is not critical, and no post-test analysis of data is involved. Most importantly, there is no gaze calibration step necessary to tell the device what to interpret as central fixation, because it detects central fixation directly via the geometry of the fovea.
Based on the distributions in Figures 5-7, it can be seen that either of the two measures alone, the Fixation Index FI, or the Variability Index VI, might be used to separate ADHD patients from normal controls, be it in the presence of a video, or without a video. The exact thresholds and classification power can be obtained in a larger scale study. In real life, though, especially with young children who are not very compliant even without ADHD, one of the measures can be distorted due to different interference factors, such as undesirable head movements. For example, movement of the subject’s head to one side may cause part of the scanning circle to become eclipsed. This will result in reduction of the power of the central fixation frequency P2f, and a drop in the RP ratio, thus decreasing the Fixation Index FI. In this case, a correct measurement of the Variability index VI will help the system to make the correct decision. Further, the two measures most likely reflect two different underlying mechanisms. While FI reflects the general tendency of the subject to stay focused on the task and can attest to maintaining attention during a certain time interval, VI is more likely to represent saccades and impulsivity, or inefficient mechanisms to suppress them. It is known that inhibition is one of the most prominent cognitive domains affected by ADHD.1, 22, and these results are corroborated by previous findings. 10, Munoz, 2003 #205, etc. Given that computing both parameters does not take any additional hardware or computational power, we think that using both parameters for separating the two groups is justified.
There is an outlier “ADHD” appearing very near to the “cloud” of normal controls (Figures 6 and 8). Because of the high fixation index of 93.3% at a relatively low variability index of 16.1% (subject #4 in Table 2), we suspect that this patient might have been over-diagnosed. Yet, while the device and methods used show diagnostic potential, this is a study of limited scope, and does not allow making diagnostic conclusions.
As mentioned in the Introduction, detection of avoidance of eye contact can be used to identify children with early signs of autism spectrum disorders (ASD) in the first two years of life, enabling early behavioral intervention when it can be most helpful. Using technology similar to that reported here to determine the presence or absence of visual engagement could materially help in the identification of young children with early ASD.
A limitation of the device presented here is that it is only a monocular device. For many purposes this may suffice, yet some applications such as “joint attention” gaze tasks would require a binocular implementation. Also, a study reported three-fold greater incidence of convergence insufficiency in the ADHD population 13. This makes convergence insufficiency (detectable with binocular technology of this type) a potential factor to help diagnose ADHD. Our lab has developed a binocular instrument 17 for detection of eye misalignment with the goal of detecting risk factors for amblyopia in young children, and is in the process of improving it. We believe that the newer binocular instrument can be adapted to applications involving attention detection and exploration.
Another limitation is the small number of test subjects, defined by the very limited ability to recruit study participants from the usual patient population of our pediatric ophthalmology clinic, adjacent to our lab. The presence of ADHD is not always reported on the patient charts, and even when it is, patients usually need to come again on a different day – either because they are already dilated, or because they are on medication.
CONCLUSION: The technology described here can be useful in identifying and studying ADHD patients. It can also be used in a variety of attention-assessing tasks, without the need for gaze-direction calibration.
The above material has partially
been borrowed from the following publication:
Gramatikov, B., Irsch,K., Müllenbroich,M., Frindt,N., Qu,Y., Gutmark,R. Wu,Y.-K., Guyton,
D. A Device for Continuous
Monitoring of True Central Fixation Based on Foveal Birefringence. Annals
of Biomedical Engineering, Vol. 41, Issue 9 (1 Sept 2013), pp.
1968-1978. Also Epub
ahead of print: May 4, 2013. DOI: 10.1007/s10439-013-0818-2. PMID:
23645511.
http://link.springer.com/article/10.1007%2Fs10439-013-0818-2
REFERENCES
1Barkley, R.A.
Behavioral inhibition, sustained attention, and executive functions:
constructing a unifying theory of ADHD. Psychol
Bull 121: 65-94, 1997.
2Clarke,
A.H., J. Ditterich, K. Druen, U. Schonfeld, and C. Steineke. Using high frame rate CMOS sensors for
three-dimensional eye tracking. Behav Res
Methods Instrum Comput 34: 549-560,
2002.
3Corden,
B., R. Chilvers, and D. Skuse. Avoidance
of emotionally arousing stimuli predicts social-perceptual impairment in
Asperger's syndrome. Neuropsychologia 46: 137-147, 2008.
4Cornsweet,
T.N. and H.D. Crane. Accurate
two-dimensional eye tracker using first and fourth Purkinje images. J Opt Soc Am 63: 921-928, 1973.
5Crais,
E.R., L.R. Watson, G.T. Baranek, and J.S. Reznick. Early identification of autism: how early can
we go? Semin Speech Lang 27: 143-160, 2006.
6Dalton,
K.M., B.M. Nacewicz, T. Johnstone, H.S. Schaefer, M.A. Gernsbacher, H.H.
Goldsmith, A.L. Alexander, and R.J. Davidson.
Gaze fixation and the neural circuitry of face processing in autism. Nat Neurosci 8: 519-526, 2005.
7Eizenman,
M., R.C. Frecker, and P.E. Hallett.
Precise non-contacting measurement of eye movements using the corneal
reflex. Vision Res 24: 167-174, 1984.
8Forbes,
G.B. Clinical Utility of the Test of
Variables of Attention (TOVA) in the diagnosis of Attention-Deficit /
Hyperactivity Disorder. Journal of
Clinical Psychology 54: 461-476,
1998.
9Frindt,
N. Alignment and testing of an eye
fixation monitor for ADHD diagnosis and research. Masters Thesis, pp. 59,
Department of Clinical Medicine Mannheim, Ruprecht Karls University, Heidelberg,
Germany, 2007.
10Gould,
T.D., T.M. Bastain, M.E. Israel, D.W. Hommer, and F.X. Castellanos. Altered performance on an ocular fixation
task in attention-deficit/hyperactivity disorder. Biol Psychiatry 50: 633-635,
2001.
11Gramatikov,
B.I., O.H. Zalloum, Y.K. Wu, D.G. Hunter, and D.L. Guyton. Birefringence-based eye fixation monitor with
no moving parts. J Biomed Opt 11: 34025, 2006.
12Gramatikov,
B.I., O.H. Zalloum, Y.K. Wu, D.G. Hunter, and D.L. Guyton. Directional eye fixation sensor using
birefringence-based foveal detection. Appl
Opt 46: 1809-1818, 2007.
13Granet,
D.B., C.F. Gomi, R. Ventura, and A. Miller-Scholte. The relationship between convergence
insufficiency and ADHD. Strabismus 13: 163-168, 2005.
14Guyton,
D.L., D.G. Hunter, S.N. Patel, J.C. Sandruck, and R.L. Fry. Eye Fixation Monitor and Tracker. U.S. Patent No. 6,027,216, 2000.
15Hunter,
D.G., S.N. Patel, and D.L. Guyton.
Automated detection of foveal fixation by use of retinal birefringence
scanning. Appl Optics 38: 1273-1279, 1999.
16Hunter,
D.G., J.C. Sandruck, S. Sau, S.N. Patel, and D.L. Guyton. Mathematical modeling of retinal
birefringence scanning. J Opt Soc Am A 16: 2103-2111, 1999.
17Hunter,
D.G., D.S. Nassif, N.V. Piskun, R. Winsor, B.I. Gramatikov, and D.L.
Guyton. Pediatric Vision Screener 1:
instrument design and operation. J Biomed
Opt 9: 1363-1368, 2004.
18Hunter,
D.G., N.V. Piskun, D.L. Guyton, B.I. Gramatikov, and D. Nassif. "Clinical
performance of the Pediatric Vision Screener.," in ARVO.
Edited, Ft. Lauderdale, FL, 2004.
19Irie,
K., B.A. Wilson, R.D. Jones, P.J. Bones, and T.J. Anderson. A laser-based eye-tracking system. Behav Res Methods Instrum Comput 34: 561-572, 2002.
20Irsch,
K., B. Gramatikov, Y.K. Wu, and D. Guyton.
Modeling and minimizing interference from corneal birefringence in
retinal birefringence scanning for foveal fixation detection. Biomed Opt Express 2: 1955-1968, 2011.
21Jones,
W., K. Carr, and A. Klin. Absence of
preferential looking to the eyes of approaching adults predicts level of social
disability in 2-year-old toddlers with autism spectrum disorder. Arch Gen Psychiatry 65: 946-954, 2008.
22Karatekin,
C. Improving antisaccade performance in
adolescents with attention-deficit/hyperactivity disorder (ADHD). Exp Brain Res 174: 324-341, 2006.
23Klin,
A., W. Jones, R. Schultz, F. Volkmar, and D. Cohen. Defining and quantifying the social phenotype
in autism. Am J Psychiatry 159: 895-908, 2002.
24Landa,
R. and E. Garrett-Mayer. Development in
infants with autism spectrum disorders: a prospective study. J Child Psychol Psychiatry 47: 629-638, 2006.
25Landa,
R. Early communication development and
intervention for children with autism. Ment
Retard Dev Disabil Res Rev 13:
16-25, 2007.
26Landa,
R.J., K.C. Holman, A.H. O'Neill, and E.A. Stuart. Intervention targeting development of
socially synchronous engagement in toddlers with autism spectrum disorder: a
randomized controlled trial. J Child
Psychol Psychiatry 52: 13-21, 2011.
27Mahone,
E.M., S.H. Mostofsky, A.G. Lasker, D. Zee, and M.B. Denckla. Oculomotor anomalies in
attention-deficit/hyperactivity disorder: evidence for deficits in response
preparation and inhibition. J Am Acad
Child Adolesc Psychiatry 48:
749-756, 2009.
28Merin,
N., G.S. Young, S. Ozonoff, and S.J. Rogers.
Visual Fixation Patterns during Reciprocal Social Interaction
Distinguish a Subgroup of 6-Month-Old Infants At-Risk for Autism from Comparison
Infants. J Autism Dev Disord 37: 108-121, 2007.
29Mostofsky,
S.H., A.G. Lasker, L.E. Cutting, M.B. Denckla, and D.S. Zee. Oculomotor abnormalities in attention deficit
hyperactivity disorder: a preliminary study. Neurology 57: 423-430, 2001.
30Mostofsky,
S.H., A.G. Lasker, H.S. Singer, M.B. Denckla, and D.S. Zee. Oculomotor abnormalities in boys with
tourette syndrome with and without ADHD. J
Am Acad Child Adolesc Psychiatry 40:
1464-1472, 2001.
31Müllenbroich,
M.C. Design and construction of a fixation
stability monitor for diagnosis and management of ADHD. Masters Thesis, pp. 69,
Faculty of Clinical Medicine Mannheim The Ruprecht Karls University,
Heidelberg, Germany, 2006.
32Munoz,
D.P., I.T. Armstrong, K.A. Hampton, and K.D. Moore. Altered control of visual fixation and
saccadic eye movements in attention-deficit hyperactivity disorder. J Neurophysiol 90: 503-514, 2003.
33Nikolaev,
A.R., C. Nakatani, G. Plomp, P. Jurica, and C. van Leeuwen. Eye fixation-related potentials in free
viewing identify encoding failures in change detection. Neuroimage 56: 1598-1607,
2011.
34Pruehsner,
W. and J.D. Enderle. Eye tracker. Biomed Sci Instrum 35: 235-240, 1999.
35Reulen,
J.P., J.T. Marcus, D. Koops, F.R. de Vries, G. Tiesinga, K. Boshuizen, and J.E.
Bos. Precise recording of eye movement:
the IRIS technique. Part 1. Med Biol Eng
Comput 26: 20-26, 1988.
36Rogers,
S.J. Empirically supported comprehensive
treatments for young children with autism. J
Clin Child Psychol 27: 168-179,
1998.
37Ross,
R.G., D. Hommer, D. Breiger, C. Varley, and A. Radant. Eye movement task related to frontal lobe
functioning in children with attention deficit disorder. J Am Acad Child Adolesc Psychiatry 33: 869-874, 1994.
38Sliney,
D. and M. Wolbarsht. Safety with Lasers and Other Optical Sources., Plenum
Press, New York and London, 1980.
39Sun, L.,
Y. Wang, Y. Han, and R. Zhu.
[Exploratory eye movement in children with ADHD]. Beijing Da Xue Xue Bao 35:
284-287, 2003.
40van der
Geest, J.N., C. Kemner, G. Camfferman, M.N. Verbaten, and H. van Engeland. Looking at images with human figures:
comparison between autistic and normal children. J Autism Dev Disord 32:
69-75, 2002.
41Young,
G.S., N. Merin, S.J. Rogers, and S. Ozonoff.
Gaze behavior and affect at 6 months: predicting clinical outcomes and
language development in typically developing infants and infants at risk for
autism. Dev Sci 12: 798-814, 2009.